Join Us language change  image
A+ A- A
Light Dark
×

Where is China + 1 ?


Published
Blog Image Blog Image

The return of Chinese exports and disinflationary force

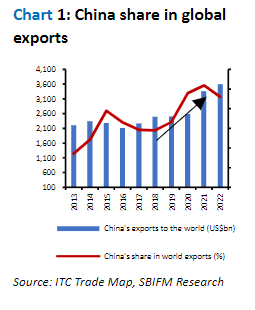
The prevalent narrative is around shifting of manufacturing capacities out of China with the objective of reducing the world’s dependency on Chinese exports. If this were to be playing out, then there should be some signs of slowing exports out of China or a loss in market share for Chinese exports. Initial data seems to suggest otherwise.

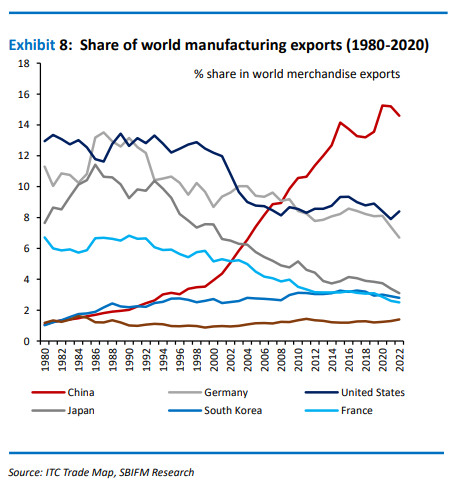
Contrary to the running rhetoric of China +1, China has recently gained exports market share by 1.7% pt. in last five years (Chart 1). Over the past 5 years, China’s exports mix has also shifted away from consumer goods and increasingly towards capital goods.

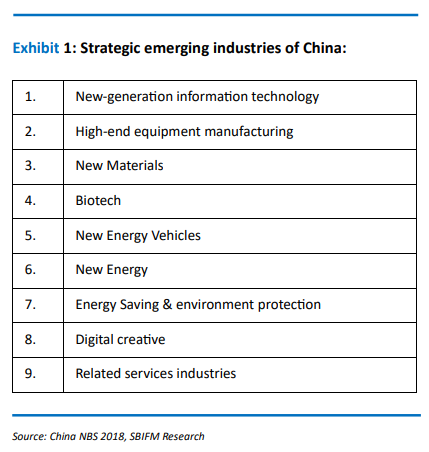
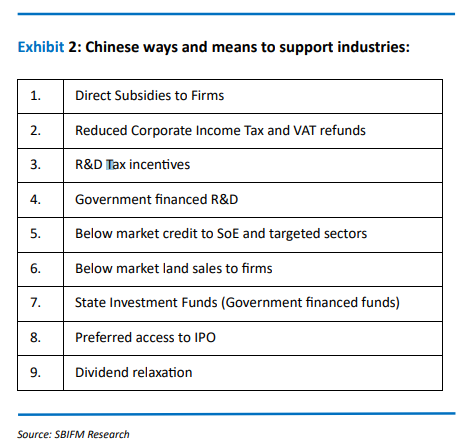
China is investing significant resources towards its industrial policy, more so post COVID. The Chinese government has identified a few strategic sectors, specifically in the realm of new age industries, and has gone all out in terms of tax breaks, subsidies, preferential access to funding and state support to accelerate manufacturing sector investment and production.

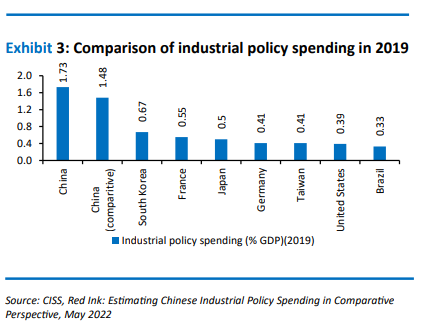
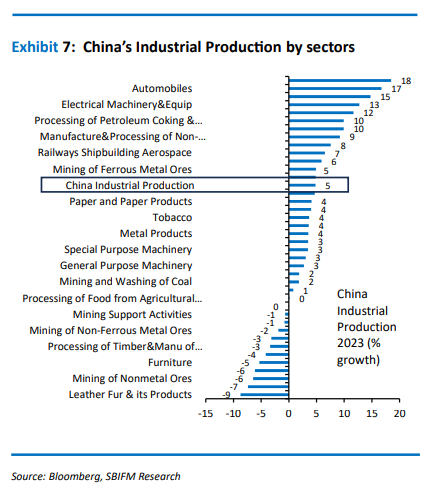
China spends far more on supporting its industries than most other key economies. And consequently, we can see significant capacity addition and production out-performance in the automobiles, electrical machinery, chemicals, nonferrous metals, railway shipbuilding and aerospace sectors. Gradually, the production capacity is outpacing the demand, leading to reduced capacity utilization in a few sectors. At the current pace of industrial capex push, the problem of overcapacity could accentuate in the future. And hence, Chinese manufacturers with excess capacity coupled with cost advantages will have adequate incentive and capability to be price competitive.

This means that at least one of the factors (i.e. China’s cheap exports) that contributed to structurally lower inflation over the past two decades is not going away, and potentially even getting stronger.

Today, globally, policy making is focused on the industrial capex. Knowing the competition is critical for India while designing its policy framework and for us as an investor while riding on the manufacturing sector and industrial capex theme. Some of the sectors like electric vehicles, solar-panels, semiconductors, and other high-end equipment manufacturing may face stiff competition from increased Chinese supply in the future. At the same time China is indeed vacating the space in some of the low value consumer products.

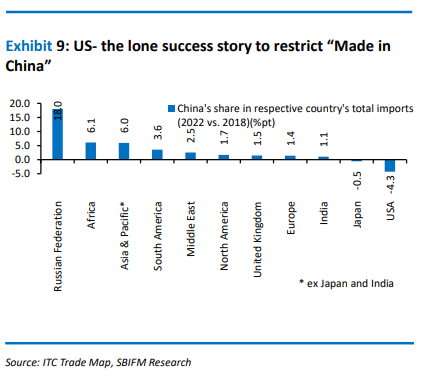
Secondly, China +1 has so far been a limited exports opportunity for India. It provided an increased market share gain in the US market. But more than the China+1 policies or shift in sourcing, there has been the reduced industrial production in Germany and few other European countries (probably driven by the energy crisis post the Russia-Ukraine war) which has played out favourably for Indian exporters.

Third, we often debate on industrial policy support and whether taxpayers should subsidize ‘rich’ businesses. In today’s environment, if Indian manufacturers do not receive sufficient policy support, perhaps the Chinese manufacturing process could hollow out India’s production potential and leave India as a permanent import dependent and current account deficit nation. No nation is playing by the fair rule of comparative advantage. In fact, we find that other countries (both US, and China) have increased support to R&D spending by the industries. Perhaps, India could also design our policy with a greater bias towards innovation.

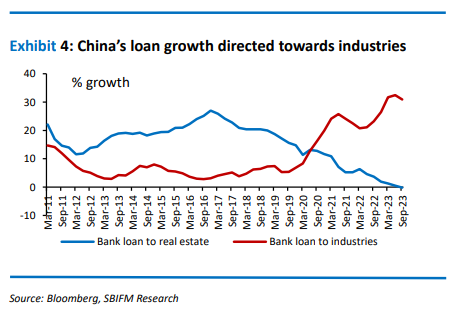
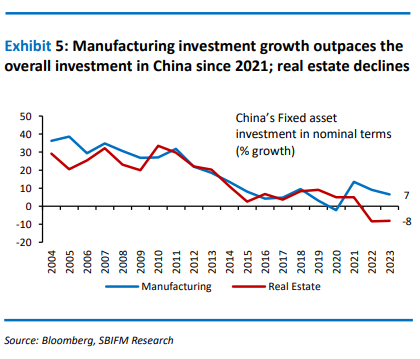
China officially launched its policy prioritization of emerging industries in 2010, and within a decade, it has become one of the major players in a wide range of cutting-edge technologies such as green energy, 5G telecommunications, and the manufacturing of various industrial equipment. Now, with the Chinese real estate sector on a clear decline and the United States blocking the availability of select technology intensive products to Chinese manufacturers, China has doubled down on expanding its manufacturing sector’s capabilities.

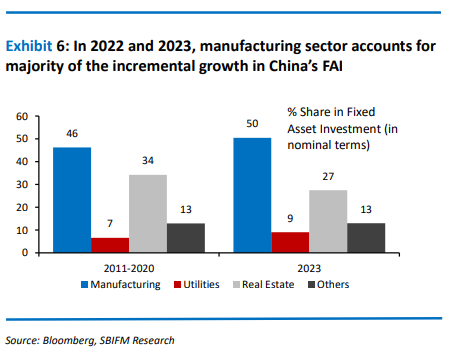
At present, India is promoting its manufacturing sector largely by providing a subsidy to a specific set of companies in identified sectors. The subsidy grants are conditional on yearly milestones in investment, production, and domestic value addition in specific cases (see SBIFM Market Insights July 2023, A manufacturing renaissance?).. On the other hand, China has gone all out and appears much more aggressive than other countries in its industrial policy support (Exhibit 3). As a share of GDP, China spends over twice as much as South Korea on its industrial policy. And in dollar terms, China spends more than twice as much as done by the United States (as of 2019) 2

Image

Namrata Mittal

Chief Economist
Image

Varnika Khemani

Economist
Image

Starting 2018, China has reduced corporate income tax from 25% to 15% for high and new technology enterprises3. Theoretically, to qualify for this status, a company must meet a whole bunch of criteria. However, two thirds of China’s onshore-listed enterprises reported their statutory tax rate at 15% or below4. A full refund of VAT to exporters has been in practice since 19945. From 2022 onwards, a 200% pre-tax super deduction of R&D expenses is also granted to these strategic industries (the measure was first introduced in 2018 and the criteria got relaxed to 200% in 2022)5. These industries also get a favourable treatment in their dividend payout policy as opposed to a general mandate for listed Chinese firms to pay dividend ranging from 20% to 80% depending on development stage and capex requirements4 (Exhibit 2). In March 2021, in its work report from the National People’s Congress (NPC) session, China set a target of increasing the annual R&D spending by more than 7% every year for next five years, as part of its commitment to boosting technology and research. In 2022, it increased by 10%6.

China is much more aggressive than other key economies in its industrial policy support.

To sum, the main mechanisms of support are tax incentives, subsidies, and preferential access to funding (Exhibit 4). These factors work in combination with other state assistance to potentially improve the return on invested capital and make it more attractive for private investment.

Consequently, the manufacturing sector has taken the capex baton in China- enabling gross capital formation growth to match the overall growth in the economy even as real estate investment is on decline. In 2022 and 2023, manufacturing sector fixed asset investment accounts for majority of the incremental growth in China’s fixed asset investment (Exhibit 5). Apart from manufacturing, China is also focusing on utilities investment after widespread power shortages in Dec 2020 and Sep 2021. The share of utilities and manufacturing investment has risen from 7% and 46% during the last decade to 9% and 50% respectively in 2023 while the share of real estate in annual fixed asset investment has dropped from 34% to 27% during the same period (Exhibit 6).

Tax incentives, subsidies, preferential access to funding and state assistance are key policy support.

Within the manufacturing sector, most of the incremental investment comes from electrical equipment and machinery, automobile, special purpose machinery and chemicals. These sectors capture the supply chain for electric vehicles, semiconductors and solar.

Investment thrust in electrical equipment, machinery, automobile, special purpose machinery and chemicals.

We can clearly see significant production out-performance in the automobiles, electrical machinery, chemicals, nonferrous metals, railway shipbuilding and aerospace sectors (Exhibit 7). These sectors have also seen a significant jump in China’s exports and China’s share on overall global trade of those products. Contrary to the running rhetoric of China +1, China has gained exports market share by 1.7% pt in the last five years (Exhibit 8). Over the past 5 years, China’s exports mix has shifted dramatically towards capital goods.

Although there has been pretty strong growth in demand for some policy favoured products, like semiconductors and electric vehicles, these high levels of capex have nonetheless pushed down capacity utilization. For instance, in the auto sector, while the utilization for new EV production lines runs tight, the sector witnesses low utilization for older internal-combustion- engine lines. Such levels of utilization create a strong incentive for firms to cut prices to increase their volume of sales and drive rivals out of business. Government’s policy support may allow the Chinese firms to keep pursuing a price cutting strategy.

Shift in China’s export mix away from consumer goods towards capital goods.

This means that at least one of the factors that contributed to structurally lower inflation over the past two decades is not going away, and probably even getting stronger. Chinese export prices have given up most of the gains seen during COVID supply disruptions even as those from competitors like Mexico and Japan is on the rise. In last 13 years, China’s PPI has grown at just 0.3% CAGR, significantly lower than other countries. For automobiles, and multiple machinery, the industry has seen a deflation (Exhibit 10). China’s real estate boom drove the commodity upcycle in 2003-2011. However, the current policy focus is strictly towards industries which are less material intensive (barring a few exceptions). More so, even as manufacturing investment is on the rise, overall fixed asset investment in China is growing at low single digits (3% in 2023). Thus, the current investment cycle in China may not lead to a parallel surge in commodities.

China to stay as a global disinflationary force

But in the past, other countries gave in to the Chinese industry hollowing out their own manufacturing sector. Today, they are pushing back. While the scale of industrial sector support in China is by far the most aggressive, a combination of protectionism and subsidies is already leading to some revival in the US’ factory construction. After the US, Europe is aiming at more aggressive anti-dumping policies against Chinese automobiles and solar equipment exports7. India has been increasingly active in blocking Chinese investment and banning mobile apps and attempting to enforce import restrictions on electronics imports. And since August 2023, Mexico has temporary import duties up to 25% on goods (including steel, aluminium, textiles, footwear, tires, plastics, glass, paper, cardboard, electrical equipment, and ceramic products) from countries with whom it does not have a preferential or free trade agreement, of which China is by far the most prominent. However, it wouldn’t be a one-way battle. China would likely impose countervailing duties and try to arm-twist nations where it has significant loans.

Over the coming years, every key nation is focused on increased industrial capex. This means that over the coming years, we could potentially see a higher duplication of production capacity.

Knowing the competition is critical for India while designing its policy framework and for us as an investor while riding on the manufacturing sector and industrial capex theme. Some of the sectors like electric vehicles, solar-panels, and semiconductors face stiff competition from increased Chinese supply in the future while China is vacating the space in some of the low value consumer products. China +1 has so far had been a limited exports opportunity for India. It provided an increased market share gain in the US market (Exhibit 9). More than China+1, there has been the reduced industrial production in Germany and few other European countries (probably driven by the energy crisis post the Russia-Ukraine war) which has played out favourably for Indian exporters. In today’s environment, if Indian manufacturers do not receive sufficient policy support, Chinese manufacturing process could hollow out India’s production potential and leave India as a permanent import dependent and current account deficit nation. No nation is playing by the fair rule of comparative advantage.

Image Image Image Image Image Image Image Image Image Image

References

  • 1Classification of Strategic Emerging Industries (2018), China NBS 2018
  • 2Gerard DiPippo-et-al, Red Ink: Estimating Chinese Industrial Policy Spending in Comparative Perspective, May 2022
  • 3What Are the Tax Incentives in Chinato Encourage Technology Innovation?(updated), March 2023, https://www.china-briefing.com/news/taxincentives-china-to-encourage-technology-innovation-updated/
  • 4Thomas Gatley, How Markets Multiply Subsidies, Gavekal Dragonomics, September 2021
  • 5Export VAT Rebate in China, August 2019, https://www.dezshira.com/library/qa/export-vat-rebate- china..
  • 6China ramps up tech commitment in 5-year plan, eyes 7% boost in R&D spend, March 2021, https://www.reuters.com/article/us-china- parliament-technology-idUSKBN2AX055/
  • 7Thomas Gatley et al, China’s coming Trade war with Europe, Gavekal Dragonomics, January 2024

This presentation is for information purposes only and is not an offer to sell or a solicitation to buy any mutual fund units/securities. The views expressed herein are based on the basis of internal data, publicly available information & other sources believed to be reliable. Any calculations made are approximations meant as guidelines only, which need to be confirmed before relying on them. These views alone are not sufficient and should not be used for the development or implementation of an investment strategy. It should not be construed as investment advice to any party. All opinions and estimates included here constitute our view as of this date and are subject to change without notice. Neither SBI Funds Management Limited, SBI Mutual Fund nor any person connected with it, accepts any liability arising from the use of this information. The recipient of this material should rely on their investigations and take their own professional advice.

Measures to restrict China exports would continue to rise in coming years. More nations would join in.

;