The Indian money market serves as the primary channel for
short-term funding across banks, public financial
institutions, non banking financial companies (NBFCs),
Housing Finance Companies (HFCs) and large corporates.
Certificates of Deposit (CDs), largely issued by banks,
and Commercial Papers (CPs), issued by corporates and
financial entities, form the backbone of this ecosystem.
On the demand side, mutual funds constitute the dominant
investor base in these instruments.
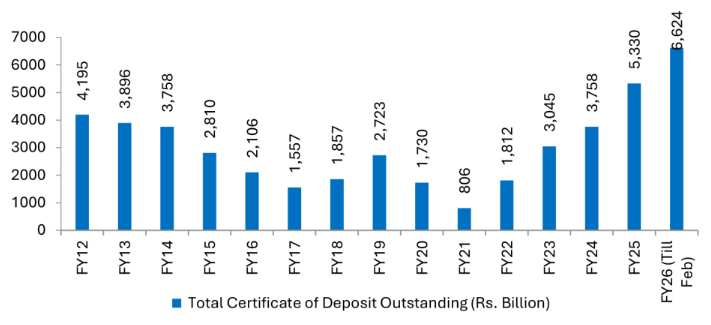
Recent developments suggest that the money market has
entered a phase characterized by elevated CD issuance
(Exhibit 1), structurally wider spreads, low CP issuances
by corporates, alongside an ever-prevalent feature of low
secondary liquidity
Exhibit 1:
Certificate of Deposits (CD) by Scheduled Commercial
Banks issuances rise
 Source :
RBI, SBIFM Research
Source :
RBI, SBIFM Research
However, unlike earlier episodes of stress, particularly
the post-IL&FS period of 2018-19, current conditions do
not appear to stem from credit deterioration. Instead,
they reflect a complex interaction between structural
investment preferences by retail investors, and regulatory
requirement of Liquidity Coverage Ratio (LCR) by banks,
seasonal Asset under management (AUM) patterns for mutual
funds, and portfolio construction preferences within the
mutual fund industry.
Structural liquidity tightening and expansion of CD
issuances
From mid-2023 onwards, banking system liquidity began
normalizing after a prolonged period of surplus conditions
(Exhibit 2). Banks, that had earlier relied comfortably on
deposit growth, increasingly faced challenges in
mobilizing incremental deposits at competitive rates. At
the same time, credit offtake began to show signs of
revival. Since 2022, barring a brief period of Oct-2024 to
Oct 2025, bank credit had been healthy and has outpaced
the deposit growth (Exhibit 3). Even now, bank credit has
recovered sharply from the May’2025 lows of 9% to 14.5% by
Jan 2026, with most banks revising their credit growth
guidance for FY27 upward. This combination-deposit
mobilization pressures alongside steady credit
demand-pushed banks toward greater reliance on wholesale
funding through CDs (Exhibit 4).
Exhibit 2:
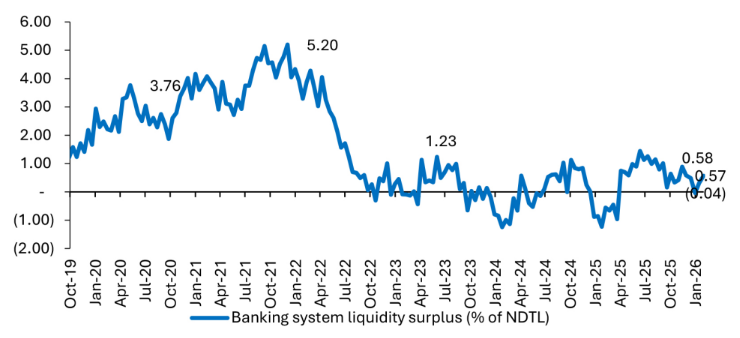 Source : RBI, SBIFM Research; NB:
Banking system liquidity refuse to net LAF
surplus
Source : RBI, SBIFM Research; NB:
Banking system liquidity refuse to net LAF
surplus
Exhibit 3:
Bank credit growth has been outpacing deposit
growth…
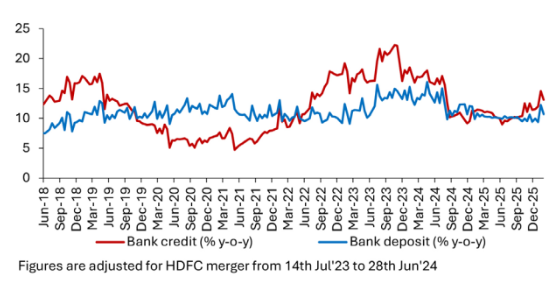 Source : RBI, SBIFM Research
Exhibit 4:
...thereby pushing up the system system-wide
credit-deposit ratio to elevated levels
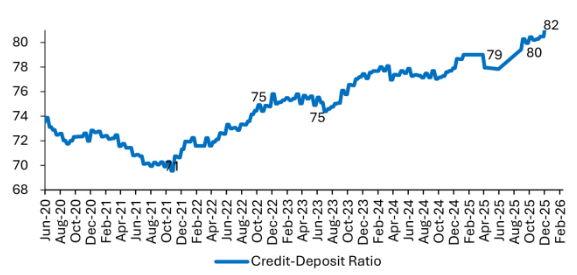 Source: RBI, SBIFM Research
Outstanding CD issued by scheduled commercial banks rose
significantly, expanding from approximately Rs. 3 trillion
at the start of 2023 to ~Rs. 6 trillion by end Jan 2026.
Jan and Feb 2026 witnessed particularly strong issuance
activity. This shift reflected banks’ emphasis on resource
mobilization, especially in the context of quarter-end
balance sheet considerations and improved loan growth
momentum.
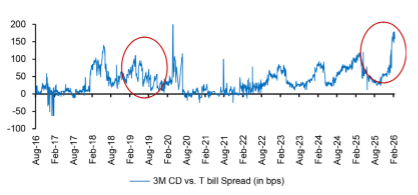
Alongside higher issuance volumes, spreads on CDs relative
to 3-month Treasury Bills widened meaningfully (Exhibit
5). After an initial softening following policy rate cuts
during 1H 2025, spreads began rising steadily from
July’2025 onward, moving from roughly 30–40 basis points
to 75-80bps by end 2025 and touched even 175bps by
Feb’2026 over relevant T-bill. The current spread levels
are even higher than those observed during the liquidity
dislocation of 2018–19. However, unlike that period, the
present widening does not reflect concerns over asset
quality or counterparty risk; instead, it mirrors
structural supply-demand imbalances and the funding needs
of banks operating under tighter deposit conditions.
Exhibit 5:
3-month CD spreads have widened to ~175bps against
T-bill by end January 2026
 Source : Bloomberg, SBIFM
Research
Source : Bloomberg, SBIFM
Research
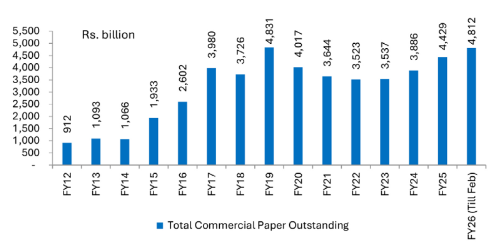
Exhibit 6:
Total CP outstanding is nearly INR 2 trillion lower
than CDs outstanding
 Source: RBI, SBIFM Research
What explains high CD issuances but low CP issuances by
corporates ?
While CD supply surged (i.e. the short-term funding needs
of banks surged), the Commercial Paper (CP) market is
experiencing a noticeable moderation (Exhibit 6).
Corporates that had previously accessed short-term
markets, reduced or halted CP issuance. CP spreads are
relatively more compressed. This is because anecdotal
evidence suggests that bank working capital lines linked
to external benchmark lending rates (often T-bills plus
some spread) are cheaper than likely CP yields. Clearly,
the latter is more cost-effective. To sum, corporate
borrowing from money market is low due to more attractive
rates being offered by banks.
The CP market consequently became concentrated in issuance
by NBFCs, housing finance companies, and select public
financial institutions. As corporate CP volumes
diminished, the breadth of tradable names has narrowed
significantly, further reducing market depth, especially
beyond very short tenor.
While the supply is rising, demand appetite for money
market instruments is weak
On the demand side, mutual funds constitute the dominant
investor base in the money market instruments.
While CD issuances are on the rise, the fund flows in the
relevant mutual fund schemes, which can subscribe to money
market papers, is limited. To give some backdrop, the
Indian mutual fund framework imposes clear limits on
duration and credit risk through SEBI’s category
classification system. Each debt category has prescribed
Macaulay duration limits and weighted average credit score
requirements. Funds cannot freely migrate to riskier
profiles without regulatory and documentation changes.
In practice, this structure enforces discipline but
reduces flexibility during volatile periods. Liquid funds,
for example, cannot invest beyond 91 days, while overnight
funds are restricted to one-day instruments such as TREPS.
Furthermore, equity and hybrid funds often maintain cash
balances for margin requirements related to futures
positions, and these balances cannot be freely deployed
into longer-dated CP or CD instruments.
As a result, headline liquidity metrics-such as large
volumes in the collateralized TREPS market—overstate the
amount of AUM available for CD and CP deployment (Exhibit
7). Only a subset of debt funds has both the mandate and
the risk appetite to meaningfully invest beyond overnight
instruments.
Exhibit 7:
Average daily volumes in overnight segment
 Source : RBI, SBIFM Research
Taxation changes and AUM reallocation in debt mutual
funds
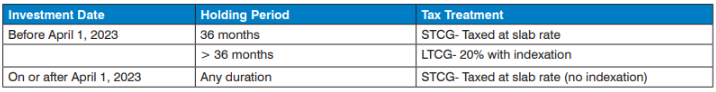
Changes in debt mutual fund taxation announced in Union
budget 2023 and made effective April 2023 significantly
altered the attractiveness of debt mutual funds for retail
investors by aligning taxation with marginal income tax
rates (Exhibit 8). Further in July 2024 budget, the
indexation benefits enjoyed by debt mutual funds, held for
over two years, were removed. This reduced the post-tax
return advantage of any debt funds relative to bank fixed
deposits.
Exhibit 8:
Taxation changes in debt mutual funds in India
announced in Union budget 2023
 Source Budget documents, SBIFM
Research
Source Budget documents, SBIFM
Research
Consequently, incremental flows into duration-oriented
debt categories have been subdued. Instead, AUM growth has
concentrated in overnight funds, which serve primarily as
corporate cash management vehicles. Liquid fund and money
market AUM has increased in line with nominal growth,
while mid to longer-duration categories have experienced
either stagnation or modest outflows
Also, incremental flows since April 2023 in pure debt
funds is now predominantly institutional and corporate,
with retail participation skewed toward hybrid and equity
categories. This shift increases managed AUM volatility,
as institutional capital is inherently more tactical and
liquidity sensitive.
Substitution from mutual fund liquid schemes to bank bulk
deposits
As banks’ struggle for both CASA (current and savings
account) and sticky fixed deposit, deposit mobilization
challenges has led banks to deploy both CD issuances and
bulk deposits as a tool to raise funds. While Mutual funds
subscribe to Bank CDs, they are a competing product to
banks’ bulk deposits. Banks’ bulk deposits do not have
daily MTM adjustments and offer competing returns to
mutual funds, thereby turning out to be a more preferred
investment avenue for some corporates in recent times.
Thus, apart from taxation, the increased bulk deposits by
banks are also driving reduced inflow into mutual fund
schemes.
Secondary market Illiquidity and market concentration
Despite large outstanding volumes of CDs and CPs, actual
secondary market liquidity remains limited (Exhibit 9).
Trading activity is concentrated in very short residual
maturities, often within 30 days, and primarily in
high-grade names. Insurance companies and provident funds
are largely absent from this segment, while banks
participate selectively, mainly for liquidity coverage
ratio (LCR) management and largely restricted to AAA
exposures within its residual maturity.
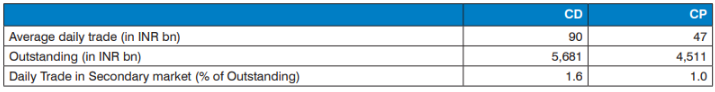
Exhibit 9:
Total Secondary Market Trade (reference period December
2025)
 Source :CCIL, RBI, SBIFM
Research
Source :CCIL, RBI, SBIFM
Research
As a result, mutual funds frequently are the only
remaining secondary trading partners. However, given that
redemption patterns are often synchronized across fund
houses, selling pressure tends to emerge simultaneously
across participants, reducing effective bid-side depth.
This structural asymmetry constrains duration rebalancing
and encourages conservative, diversified portfolio
construction. Funds are compelled to avoid concentration
risk and illiquid exposures. The illiquidity in CP markets
is especially pronounced. Outside a small set of
high-quality issuers, exit opportunities are limited,
reinforcing a hold-to-maturity bias among investors.
Furthermore, limited secondary market depth forces
investors to demand additional spread compensation for
liquidity risk.
Seasonality and flow cycles in Mutual Funds
Seasonality also plays a central role in shaping money
market dynamics. Every March, (as also around other
quarter end months) corporates withdraw significant sums
from liquid and money market funds to manage their balance
sheet and meet tax and reporting obligations. Banks also
attract short-term deposits during this period. As much as
20–25% of liquid fund assets under management (AUM) may
temporarily exit the system.
These funds typically return in April, generating strong
reinvestment demand and causing short-term rates to
decline. This predictable cycle influences portfolio
construction. For instance, in January and February,
mutual funds tend to avoid buying three-month papers to
prevent amplifying exposure to post-March reinvestment
risk.
Hence, there could be a mismatch between the tenor of
paper issued and preferred, thereby also accentuating its
impact on spreads. This recurring seasonal pattern
amplifies short-term volatility in spreads and issuance
preferences, even when underlying liquidity conditions
remain broadly stable as was the case in this financial
year.
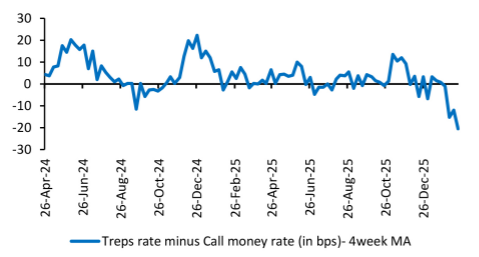
Comparative perspective and policy considerations
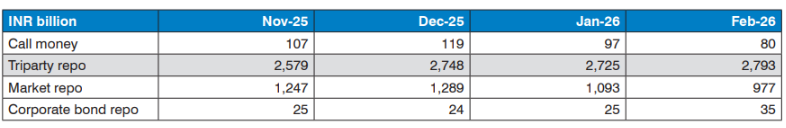
While CD rates are operating at a significant spread to
T-bills, there is a wide divergence in overnight rates.
There has been a good 25-50bps spread between TREPS and
interbank Call money rate- both key instruments in
overnight segments (Exhibit 10).
Exhibit 10:
TREPS signal excess Tri-party liquidity, yet money
markets remain unfunded
 Source: RBI, SBIFM Research
In developed markets such as the United States, money
market funds have direct access to central bank reverse
repo facilities, allowing overnight rates to align closely
with policy corridors. In India, non-bank entities lack
direct access to the Standing Deposit Facility (SDF), and
the bulk of overnight activity occurs in collateralized
segments such as TREPS. At times, this leads to meaningful
divergence between policy rates and collateralized market
rates. In current times, banks are borrowing in TREPS and
lending in RBI’s SDF platform- thereby sometimes earning
an arbitrage.
Broadening access to central bank liquidity facilities for
non-banks could potentially enhance rate transmission and
reduce volatility in collateralized segments. However,
such reforms would need to be weighed against monetary
policy transmission objectives and systemic risk
considerations.
Outlook on CD spreads in current times
There could be some moderation in CD spreads in April
after the March redemption cycle is over further the CD
supply could also moderate. Banks’s guidance suggests that
credit outlook stays healthy over the coming quarters. As
such, banks would be in continued needs of funds. However,
with current rise in CD rates, banks have seen a
flattening of yield curve in the borrowing space. This may
prompt them to gradually shift away from short-tenor CDs
towards longer tenor infrastructure and tier II bonds also
if their asset liability considerations permit.
Banks are generally restricted by regulation from issuing
regular long tenor non-convertible debentures (NCDs) and
can only issue infrastructure bonds if they have
infra-eligible assets. In FY26, there was a hiatus where
banks issued infrastructure bonds but lacked the
corresponding infra-eligible assets, which seems to be
resolved now, potentially allowing for increased supply.
There is a demand from provident funds and other long-term
investors for longer tenor papers. Hence, deploying such a
strategy could also help cooling CD spreads.
Conclusion
The current phase of India’s money market is characterized
not by credit fragility but by structural investment
pattern changes emerging from post-covid period and
frictional liquidity dynamics. The expansion of CD
issuance reflects banking system funding realities, while
the contraction of corporate CP issuance underscores the
competitive dominance of banks in an intermediated system.
On the other hand, mutual funds demand appetite has been
constrained by lack of flows in the desired schemes (both
due to taxation and better returns in competing bank
products), regulatory portfolio constraints, secondary
market illiquidity, and concentrated investor
participation. Thus, elevated CD spreads are best
understood as the equilibrium outcome of deposit
constraints, credit growth, and limited non-MF
participation.
Unless structural participation broadens or liquidity
mechanisms evolve, the Indian money market is likely to
continue exhibiting episodic mismatches between supply and
demand. These mismatches will remain a defining feature of
short-term rate behaviour, independent of underlying
credit fundamentals.


)
)


)
0bf21f855da944d2a0c843c4553297d8)