


8f42623d8b87465ba67cad88e6920a15)
)
Authors

Namrata Mittal
Chief Economist

Varnika Khemani
Economist

Ruchit Mehta
Head – Research

Pradeep Kesavan
Equity Strategist
Every major geopolitical tension forces investors to reassess the durability of global supply chains, the resilience of markets and the policy responses that follow.
On February 28, 2026, conflict erupted in West Asia, rapidly spreading to multiple Gulf nations. As a result, almost entire sea freight navigating through the Strait of Hormuz (SoH), which plays a crucial global role in Oil & Gas transportation, was halted unilaterally by Iran. Furthermore, numerous oil and gas installations belonging to various producers in the Gulf regions have suffered damage.
The current crisis in the Middle East stands apart—not because it is the first conflict in the region, but because the physical chokepoint at the centre of global energy flows is directly impaired.
Hormuz moves ~20mbpd of crude and natural gas, or about 20% of global petroleum consumption. Unlike Russia’s disruptions, which were partially mitigated by rerouting and shadow fleets, the Gulf has no meaningful bypass. LNG markets are even tighter, with no buffer inventories. Damage to gas infrastructure in Iran and Qatar further delays normalization. Freight and insurance premia have already jumped, reflecting real‑time risk repricing.
What is the current movement in commodities?
Energy markets have already experienced sharp moves this year. Brent and WTI crude prices have risen 55% year‑to‑date (as of 19 March 2026), while the increase in key refined fuels has been even steeper. LNG prices are up 72% YTD, heating oil 67%, diesel 75%, and petrol 60%. Even coal—often seen as an alternative energy source—has risen 22% YTD (Exhibit 1). Together, these trends indicate broad‑based upward pressure across the energy complex, with clear implications for input costs and inflation dynamics.
In contrast, most agricultural commodities and precious metals—particularly gold—have remained relatively contained.
Exhibit 1:
Global commodity price movements YTD (as on 19th March 2026)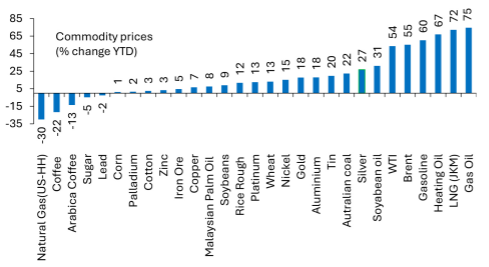 Source: Bloomberg, SBIFM Research; NB:
data as of 19th March 2026
Source: Bloomberg, SBIFM Research; NB:
data as of 19th March 2026
Global and Indian asset‑class reactions: Traditional hedges break down
The sharp rise in crude oil has triggered a meaningful global terms‑of‑trade shock, with the biggest impact falling on Europe and Emerging Markets. Relying on the historical tendency to fade geopolitical shocks may not work entirely in the current backdrop. Typically, when risk assets such as equities or emerging‑market currencies decline, investors expect bonds and gold to act as hedges, providing diversification and cushioning portfolio losses. In this episode, however, both traditional hedges have failed simultaneously. Bonds are struggling because higher oil prices are generating an inflationary impulse (Exhibit 2). Gold—normally expected to rally during geopolitical stress—is instead declining, possibly due to extreme levels of retail speculation (Exhibit 3).
The only asset currently functioning as a hedge is the US dollar—ironically, at a time when global investors had spent several months trying to reduce USD exposure in their portfolios. This shift has made hedging particularly challenging, as previously reliable diversification channels have temporarily collapsed, complicating risk‑management strategies.
Despite superficial similarities to the 2022 European energy crisis, today’s environment is meaningfully different. Global fiscal policy is expansionary rather than contractionary, with countries such as Germany, Sweden, Australia, and the US all introducing significant stimulus. Real wage growth is now positive, unlike in early 2022 when consumers were under pressure. As a result, central banks can credibly maintain or even adopt more hawkish stances in response to rising oil. Unlike 2022, the rise in front‑end yields is not irrational—rather, it reflects a combination of inflationary supply shocks and firm underlying demand.
This environment reinforces the reality that no macro investor has an informational edge regarding geopolitical intentions. Market outcomes depend heavily on decisions made by a small number of political leaders. As long as visibility remains low, risky assets may continue to grind lower. But if any credible resolution emerges—such as a ceasefire, a policy pivot, or a declaration of mission completion—the rebound could be extraordinarily sharp.
Exhibit 2:
Global bond yields rise for both developing and emerging market economies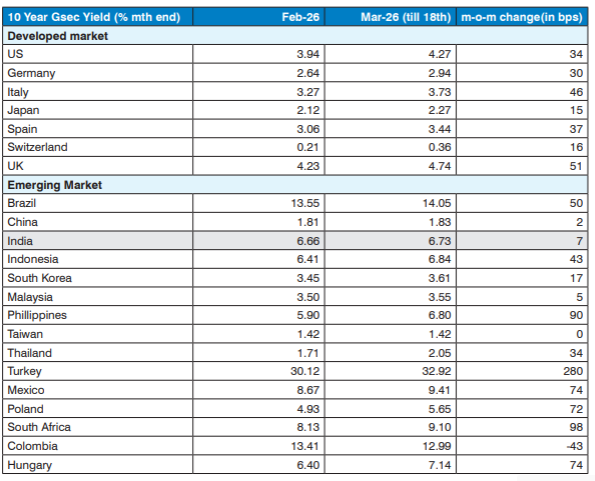 Source: Bloomberg, SBIFM Research
Exhibit 3:
Asset class performance since conflict began in West Asia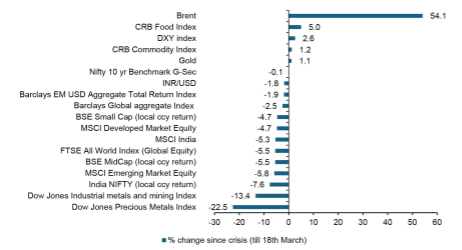 Source: Bloomberg, SBIFM Research
Historical behaviour of oil prices: Demand, supply shocks and inventory dynamics
The history of global oil prices since the early 1970s shows a pattern of sharp rises, dramatic collapses, and intermittent periods of stability, each shaped by a combination of demand forces, supply disruptions, and shifting expectations (details in Annexure). Across these decades, the most consistent theme is that demand dynamics, particularly those linked to the global business cycle, explain the majority of major oil‑price movements. Supply shocks matter, but their impact depends heavily on available spare capacity and expectations around future scarcity. Inventory demand—driven by precautionary motives—often serves as the link between geopolitical tensions and price spikes. Conversely, prices do not rise when supply losses are offset elsewhere or when global demand is weak (Exhibit 4).
Unlike past geopolitical episodes where supply losses were compensated by other producers (for example, the 1979 Iranian shortfall or the 2003 Iraq war), the current closure of the Strait of Hormuz (SoH) represents a direct and concentrated halt to physical flows. This makes the SoH disruption a much purer supply shock than the 1973 and 1979 episodes, where demand and expectations played the dominant role. Inventory demand rises sharply when market participants anticipate future shortages, and this expectation magnifies upward pressure on prices. The International Energy Agency (IEA) preparing a record 400‑million‑barrel release to soften the impact is evidence that precautionary pressures are intensifying.
In earlier episodes, such as 2003 or 2011, other producers were able to quickly offset supply losses—something that is not feasible today in a short period. Thus, if the SoH closure persists, prices will continue rising until recessionary demand compression takes hold.
Given the rising likelihood of more frequent geopolitical disruptions, even when the SoH is eventually made commercially viable again, countries are expected to rebuild inventories aggressively and more nations may consider building or expanding strategic reserves. These factors could keep crude prices elevated for an extended period unless meaningful new supply comes onstream quickly.
Exhibit 4:
History of oil price shocks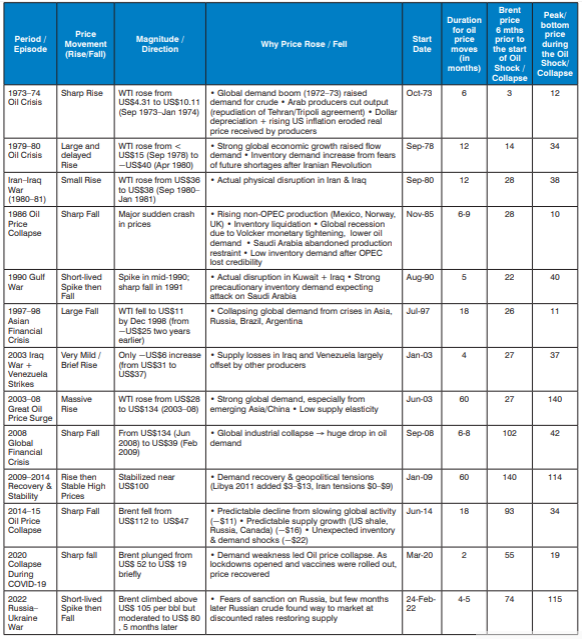
India’s exposure channels: Five direct points of vulnerability
There are at least five distinct and direct channels by which India will be hit by disruptions to trade and capital flows inflicted by the US war against Iran.
- Higher cost of energy import thus higher import bill
- Lack of adequate energy availability translating into supply side challenges in multiple industrial and service sectors
- Rising fertilizer prices and hence fertilizer subsidy, thereby leading to fiscal burden
- Disruptions in exports to the Middle East
- Remittances from Middle East slows
Exhibit 5:
India’s imports, production and consumption of Crude and related products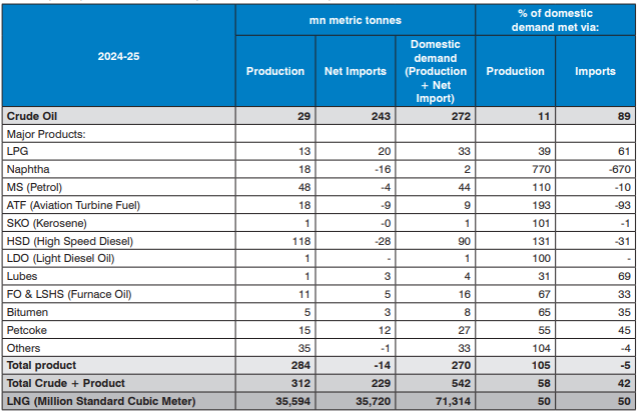 Source: PPAC, SBIFM Research
Exhibit 6:
Key source of for India’s energy imports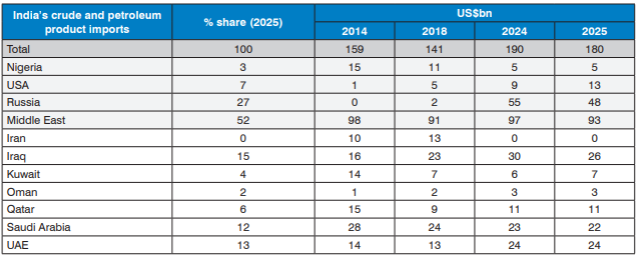 Source: CMIE Economic Outlook, SBIFM
Research
Source: CMIE Economic Outlook, SBIFM
Research
India’s dependence on Middle East
The Middle East accounts for around 14% of India’s goods exports. The UAE is the largest market, followed by Saudi Arabia. The major product exports to this region include Petroleum products (14% share of India’s petroleum product exports goes to Middle East), Gems and Jewellery (28%), Electrical Machinery and Electronics (21%), Rice(49%), Aircraft and parts (48%), Motor Vehicles/cars (23%), products of iron and steel (19%), and Organic chemicals (15%) based on FY25 data.
On the import side, India sources about half of its oil and gas requirements from the Middle East (including via SoH and other routes). Over time, India has reduced this concentration by increasing imports from Russia, the US, Africa, and Latin America (Exhibit 7). This diversification somewhat helps mitigate geopolitical‑risk exposure and enhances procurement flexibility during crises. Growing adoption of EVs, ethanol blending, CNG, solar, and wind energy has also gradually lowered India’s absolute dependence on crude, although fossil fuels still dominate.
Exhibit 7:
Country-wise India’s crude and petroleum products imports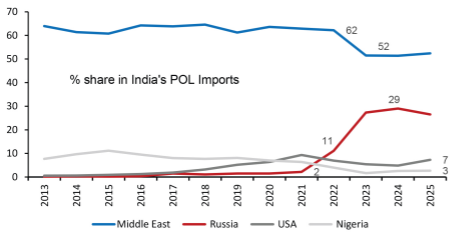 Source: CMIE Economic Outlook, SBIFM
Research
Source: CMIE Economic Outlook, SBIFM
Research
Fertilizers constitute another critical import. About 34% of India’s total fertilizer imports come from the Middle East—primarily Oman and Saudi Arabia (Exhibit 8). Importantly, most of these shipments do not transit through the Strait of Hormuz, which limits direct exposure. The deeper structural challenge lies in gas availability for domestic fertilizer production, rather than the supply of imported urea itself. Global fertilizer prices have risen sharply, with urea now almost 50% higher since December 2025.
Exhibit 8:
Fertiliser import dependence on Middle East; 34% of India’s total fertiliser imports come from the Middle East Source: ITC Trade Map, SBIFM Research;
NB: Represents ~80% of total fertiliser imports by India
Source: ITC Trade Map, SBIFM Research;
NB: Represents ~80% of total fertiliser imports by India
Almost all of India’s LPG imports and 60% of LNG imports pass through the Strait of Hormuz. As a result, reopening the SOH remains the single most critical factor for normalization of India’s energy supply
Government response: Prioritisation, rationing and policy flexibility
The government’s primary focus is to ensure uninterrupted LPG supply to households. Industrial and commercial users are being deprioritized, and LPG used in petrochemical and industrial applications is being diverted toward domestic consumption. While this improves availability for households, it shifts the burden onto industrial sectors. The government is also using allocation controls to manage distribution. Gas and LPG supplies are being rationed based on priority sectors to ensure optimal utilization of limited resources. In terms of policy tools, the government retains flexibility to deploy excise‑duty cuts, subsidies, windfall taxes, or export restrictions, depending on how the situation evolves. Past episodes suggest that all options remain open should the shock intensify or prove persistent.
Oil shock and India’s balance of payments: Widening CAD and external pressures
Every US$ 10/bbl rise in crude price widens the annual CAD by US$ 15billion. Given the exceptionally high degree of uncertainty, we are considering two scenarios: 1) Current price levels persist for 3 months before gradually moderating to pre-crisis levels 2) Crude remains close to US$100/bbl for the full year.
Under the first scenario, the CAD could widen to US$45–50 billion, compared with an estimated US$25 billion in FY26, resulting in India’s third consecutive year of a BoP deficit. We have also revised assumptions for fertilizer and coal import bills, along with remittance inflows from the Middle East (Exhibit 9).
Exhibit 9:
Impact on current account deficit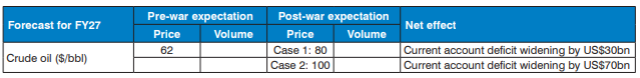 Source: CMIE Economic Outlook, SBIFM
Research
Source: CMIE Economic Outlook, SBIFM
Research
Remittance inflows are also likely to be affected, as about 38% of total inward remittances originate from the Middle East—half of which come from the UAE alone.
On the capital account, the nascent improvement in FPI flows following the US‑India trade deal has reversed, with US$8 billion in net outflows as of 16 March 2026. Debt flows could rise by US$20–25 billion if Bloomberg Barclays Bond Index inclusion materializes, but given past disappointments (e.g., January 2026), we do not treat this as a base case.
Weakening pressure on Rupee intensifies
Despite a structural improvement in India’s current‑account dynamics and a CAD that has remained below 2% of GDP since FY15 (except FY19 at 2.1%), India’s balance‑of‑payments position has weakened materially due to near‑zero net FDI inflows. This has led to a deterioration in India’s basic balance.
Since COVID, the return of inflation in the US has pushed US yields into the 3.5–5.5% range, compared with the 1.5% range that prevailed from 2009–19. This has made dollar borrowing unattractive for Indian corporates, resulting in muted ECB flows and slower NRI deposit growth. As a result, the rupee has become more sensitive to volatile FII flows, adding to downward pressure even though other macro indicators—such as low external debt, moderate inflation, and fiscal discipline—remain supportive.
India’s spot FX reserves stand at US$717 billion (as of 6 March 2026). However, the forward‑book liability is US$68 billion (as of January 2026), and is estimated to have risen by another US$20–25 billion by March 2026. After adjusting for these liabilities, the effective reserves are considerably lower.
If FII inflows fail to revive, the rupee will remain vulnerable to global shocks. We now expect a 4–5% depreciation in 2026 (vs. an earlier expectation of 2–3%). The rupee, currently trading at ₹93 per US dollar, could move toward ₹96 per US dollar over the next two quarters.
Growth to moderate as supply constraints tighten
We expect real GDP growth to moderate from an estimated 7.8% in FY26 to 6.9% in FY27, while nominal GDP is likely to rise from roughly 9% in FY26 to 12–13% in FY27, driven by higher WPI inflation.
Even if the entire crude‑price increase were passed through to consumers, the direct impact on growth would be limited unless crude remains above US$100/bbl through the first half of FY27. The more significant drag comes from supply‑side disruptions rather than price effects alone.
Because the current shock stems not only from higher prices but also from physical supply constraints, industrial output could be affected. Restrictions on commercial LPG usage may negatively impact sectors such as hotels, restaurants, and tourism. For now, we expect only a limited impact on agricultural output, as the supply situation for the Kharif season still appears manageable.
Weakness in industrial and service output could have an income effect, weighing on household consumption. Market softness may further dampepn consumer sentiment. Higher inflation in selected household goods and services could also suppress demand. Export flows to Middle Eastern nations may be disrupted, though this could be partially offset by stronger exports to other regions. India’s exports had already been weak last year due to the overhang from the India–US trade‑deal issue.
That said, elevated inflation implies that even if volume growth slows, nominal spending and nominal output may still show an increase.
Rising energy prices to exert multi‑layered fiscal pressures
There are multiple channels through which rising energy prices could affect India’s central government finances.
India remains the world’s second‑largest fertilizer importer and will continue to depend heavily on external supplies; rapid self‑sufficiency is not feasible. The more structural challenge lies in the availability of gas for domestic production, rather than in the availability of imported urea. Global fertilizer prices have risen sharply, with urea now almost 50% higher since December, which could push the subsidy bill higher.
India produces 45.9 million metric tonnes of fertilizer domestically, imports 17.7 million metric tonnes, and consumes 60.1 million metric tonnes annually. Of the total imports, 34% comes from the Middle East, largely from Oman and Saudi Arabia; though, not all the shipments pass through the Strait of Hormuz.
India begins this period with comfortable fertilizer inventories, which should allow the Kharif season to progress smoothly despite some domestic production cuts driven by constraints in LNG and sulphur availability. However, even if the conflict stabilizes within a month, the government cannot become complacent. It will still need to secure imports early and prepare adequately for the Rabi season. The Ministry has already instructed fertilizer companies to diversify import sources, even at higher procurement costs.
The government has budgeted Rs. 1.7 trillion for fertilizer subsidies in FY27, compared with Rs. 1.9 trillion in FY26 (Exhibit 10). During FY23, amid the Russia–Ukraine conflict, the subsidy rose from the budgeted Rs. 1.5 trillion to Rs. 2.5 trillion, even though fertilizer availability was largely manageable.
While near-term availability appears adequate, rising gas costs and fertilizer inflation could push the subsidy requirement upward by Rs. 300 billion or more. Proactive import planning and diversification remain essential to avoid disruptions ahead of Rabi.
Exhibit 10:
Central Government’s annual fertiliser subsidy bill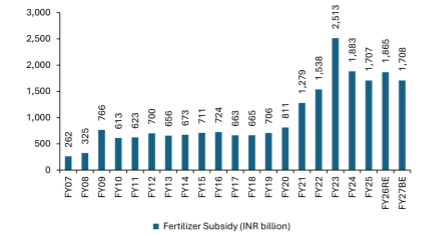 Source: CMIE Economic Outlook, SBIFM
Research
Source: CMIE Economic Outlook, SBIFM
Research
A second channel of fiscal pressure stems from the potential need to cushion domestic petrol and diesel prices. The government is likely to prefer holding retail fuel prices steady at least until major state elections conclude (by May 2025). Two options are available. First, loss absorption by oil marketing companies (OMCs).
During 2022, OMCs absorbed losses of Rs. 800–900 billion in FY23, with pressure lasting about eight months. If crude averages around US$100/bbl, annual under‑recoveries on petrol and diesel are estimated at Rs. 2.8–2.9 trillion (corresponding to roughly Rs. 17 per litre combined, monthly losses of ~Rs. 240 billion, and annual consumption of around 170 billion litres).
Every Re. 1 cut in excise duty results in an annual revenue loss of Rs. 170 billion. This lever is likely to be used only if crude remains sustainably above US$110–120/bbl. If OMCs absorb most of the shock, the fiscal impact may surface through lower dividends from public‑sector OMCs (around Rs. 250 billion in FY26). The government may offset this through windfall taxes on upstream companies or export duties on petroleum products.
In 2022, retail fuel prices rose by Rs. 10 per litre for about two months, but this was reversed through excise cuts of Rs. 8/litre on petrol and Rs. 6/litre on diesel. Prices then returned close to pre‑war levels and remained broadly stable thereafter. Windfall taxes and export duties introduced later generated roughly Rs. 250 billion in revenue.
A third channel of fiscal strain is LPG. Although LPG prices have been raised by 5% in March, OMCs may still need to absorb part of the cost, and the government may have to support any resulting under‑recoveries.
If supply disruptions persist, sectors such as restaurants, gig‑economy services, and certain manufacturing segments could experience stress. This may weigh on tax collections or require targeted fiscal support.
Despite concerns around the quality of fiscal spending, our base case assumes that both the fiscal‑deficit target and government‑securities supply remain unchanged for now. Certain expenditures may be pruned if needed. There is also potential for a higher‑than‑expected RBI dividend.
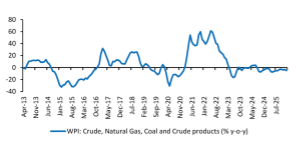
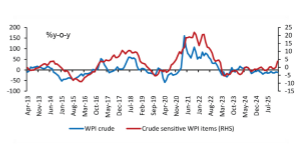
Surge in energy costs to sharply lift wholesale inflation
WPI inflation could jump from current 1.8% y-o-y to 8-10% over next couple of months. Energy and the energy sensitive items have 28% weight in WPI basket. While energy inflation could rise from -5% to 30% over next three months (Exhibit 11), crude sensitive items could start depicting 10% inflation from ~0% recently (Exhibit 12). This could lead to a generalized rise in manufacturing cost and hence manufactured output.
 Source: CMIE Economic Outlook, SBIFM
Research
Source: CMIE Economic Outlook, SBIFM
Research
 Source: CMIE Economic Outlook, SBIFM
Research
Source: CMIE Economic Outlook, SBIFM
Research
Higher WPI inflation is likely to stimulate bank credit growth, primarily because firms will require larger working-capital financing as input costs rise (Exhibit 13 &14). This would be supportive of the banking sector’s growth narrative, but it also implies upward pressure on the cost of funds, which in turn affects interest-rate dynamics. India’s fixed-income market is already navigating a scenario where both government borrowing and private credit demand are rising simultaneously, pushing the entire yield curve higher.
Exhibit 13:
Higher WPI inflation would drive bank credit growth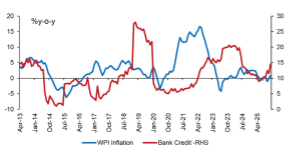 Source: CMIE Economic Outlook, SBIFM
Research
Source: CMIE Economic Outlook, SBIFM
Research
Exhibit 14:
Crude price and Bank Credit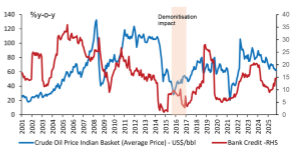 Source: CMIE Economic Outlook, SBIFM
Research
Source: CMIE Economic Outlook, SBIFM
Research
In the event of rise in supply led raw material inflation, we end up seeing a limited passthrough in final goods inflation- which could drive moderation in gross margins (Exhibit 15). During 2002 energy price spikes, we had seen 5-6% pt. moderation in corporate gross margins when WPI inflation surged from ~0 to 12%.
Exhibit 15:
Gross margins moderate in the event of input cost led WPI inflation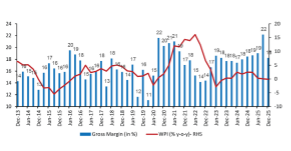 Source: CMIE Economic Outlook, SBIFM
Research; NB: Data is for 3000 companies captured in CMIE
Non financial corporates that release quarterly results
Source: CMIE Economic Outlook, SBIFM
Research; NB: Data is for 3000 companies captured in CMIE
Non financial corporates that release quarterly results
CPI outlook remains nuanced amid mixed price pressures
While the impact on WPI inflation appears more certain, CPI remains more nuanced. Globally, food prices are still stable (Exhibit 16) despite rising energy prices, though sustained increases in transportation costs could eventually push them higher—especially in a year with a heightened El Niño risk. Climate models show La Niña weakening, with the probability of El Niño rising through mid 2026.
Exhibit 16:
Global food price Index largely contained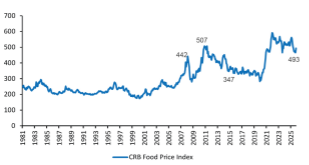 Source: Bloomberg, SBIFM Research;
NB: Data till 16 March 2026
Source: Bloomberg, SBIFM Research;
NB: Data till 16 March 2026
Exhibit 17:
Petrol and diesel prices have stayed largely unchanged in India since May 2022 despite crude price volatility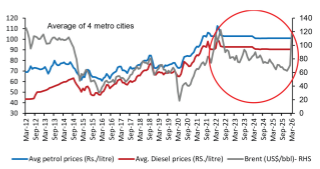 Source: CMIE, SBIFM Research
As we discussed above, Higher crude prices should have only a modest pass‑through, as oil marketing companies—and, if needed, the government—are likely to absorb much of the burden. Fuel inflation should therefore stay contained (Exhibit 17). There could be some push from LPG shortages, though electricity inflation should remain stable.
However, food inflation poses a larger risk due to an unfavourable base and potential weather disruptions during the Kharif season. We expect food inflation to jump from ~0% in FY26 to 7% in FY27.
Core inflation, too, could drift higher. Several household goods and services providers may find themselves compelled to raise prices to offset higher input costs. More importantly, inadequate energy availability is beginning to cause supply side disruptions reminiscent of COVID era constraints, particularly in services such as restaurants and delivery networks. In such situations, firms often implement staggered price hikes to compensate for past revenue losses, generating broader inflationary effects that reach beyond sectors directly impacted by energy prices. This dynamic could contribute roughly a 1% pt rise in non food, non fuel inflation.
Taking all these factors together, we expect CPI inflation to average around 5% in FY27, with certain months potentially registering readings closer to 6%.
Liquidity pressures may necessitate RBI OMO purchases in FY27 too
An elevated Balance of Payments (BoP) deficit of US$40–45bn (Rs.3.5–4 trillion) in FY27 could strengthen the case for RBI conducting OMO purchases to keep liquidity at current surplus levels. We estimate FY27 currency in circulation (CIC) leakage of Rs.2.5–3 trillion, which drains liquidity from the system. Additionally, the organic increase in CRR requirements absorbs roughly Rs.1.3 trillion annually. Together, these factors could withdraw around Rs.4 trillion of liquidity. On the offsetting side, the RBI’s budgeted dividend of Rs.2.8 trillion would inject liquidity back into the system. However, assuming a Rs.3.5 trillion BoP deficit, we still see a potential requirement for Rs.4.5-5 trillion of additional OMO purchases by RBI to maintain liquidity near current levels (Exhibit 18).
Exhibit 18:
Durable liquidity components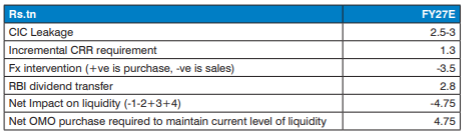 Source: RBI, SBIFM Research; NB:
Dividend figure as per BE
Source: RBI, SBIFM Research; NB:
Dividend figure as per BE
Monetary policy response: A period of pause
Current oil prices are 50% above RBI’s assumption of US$70/bbl. Despite this, we continue to see a high bar for monetary tightening. Growth risks appear underpriced, and the policy mix is likely to tilt decisively towards fiscal rather than monetary measures in a stagflationary environment. In our baseline, we continue to expect RBI to keep rates on a pause, particularly given the downside risks to growth and manufacturing activity(Exhibit 19).
Exhibit 19:
Brent crude price and interest rate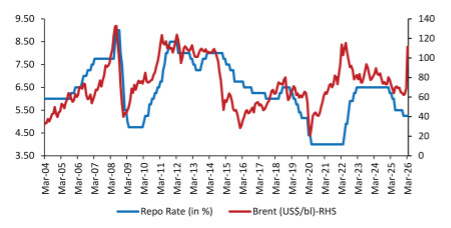 Source: CMIE Economic Outlook, SBIFM
Research
Source: CMIE Economic Outlook, SBIFM
Research
Impact on Corporate India Earnings
Energy:Oil marketing firms will be materially impacted through losses on higher crude oil purchases, MTM losses on energy price volatility, higher shipping & insurance costs. There will be an balance sheet impact as well through a need for higher working capital requirement as well as losses to be funded. Oil producers will benefit through potential higher oil prices, but likely to be constrained by the government imposing windfall taxes. Refining and Petrochemical players will see varied degrees of impact (both positive and negative) depending on product slate, sourcing capabilities and
Financials: Limited direct impact. There can be higher demand for working capital (drive higher short term credit growth), especially from oil intensive sectors on higher prices, and in general as there can be a increase in inventory holdings to counter potential supply constraints. Risks can emanate from corporate stress in sectors where production is constrained or demand is restricted.
Real Estate:There can be material delays to production schedules and/or some cost inflation due to shortages of key building material products such as tiles/ceramic products (both relay on gas in the production process), paints (higher prices) etc.
Chemicals and Fertilizers:negative impact through shortages of feedstock, positive impact from higher end product prices. The dynamic of volume shortages, cost inflation and higher pricing will determine ability to retain profitability
Consumer:Packaged foods and Beverages: Indirect impact through potential constrain for packaging materials (lower plastic production / higher prices for plastics). Potential for higher input costs on Agri commodities in case of shortages of fertilizers.
Apparel & Footwear: Potential for cost inflation / supply constraints for synthetic fibre/yarn.
Travel & Tourism:Airline travel to be impacted through higher fuel costs.
Hotels & Restaurants:Higher costs on constrained fuel supplies, constrained demand on higher costs / lower tourism.
Automotive:Cost inflation on components and parts, potential shift in demand towards alternative fuel vehicles (towards EV? Away from CNG vehicles?). Higher retail fuels costs can potential dampen demand.
Telecom:No impact except minor energy cost inflation.
Technology:No impact except minor energy cost inflation.
Textiles:material impact to artificial / synthetic fibre / yarn through constrained supplies and higher prices.
Power:No impact except minor energy cost inflation.
Pharmaceuticals: Limited impact. Potential impact from higher energy costs, shortage/higher costs of packaging and drug delivery material (plastics, glass, capsules etc). Given nature of end use will get passed on through price hikes.
Industrials & Construction:Limited impacted, potential for higher export demand going forward through re-construction efforts. Higher raw material input costs will likely get passed on. Defence expenditure is likely to see an increase which will drive demand, both domestic and exports.
Metals and Mining:Positive impact on back of higher commodity costs leading to profit expansion. Higher global demand from re-construction efforts and re-building of defence infrastructure.
Equity Strategy
Crude AwakeningThe ongoing situation in Iran has added to already long list of geopolitical risks facing the markets. This one is particularly more impactful for Indian markets, given India’s sensitivity to crude oil prices. The beginning of 2026 was portending conditions that were conducive for reflation trade, supported by an expansion in nominal growth rates. However, that backdrop got disrupted by the recent supply shock driven crude price spike. This backdrop warrants a look back at the past to see if we can draw some lessons.
Crude vs the market – the good and the badCrude’s interaction with the markets has been a mixed bag exhibiting a curvilinear tendency. That is, upto a level, an increase in crude prices act as a positive catalyst beyond which, it acts as a drag. This is because, of demand driven vs supply disruption lead increase in crude prices. The demand driven increases tend to have a more positive impact vs supply disruption lead increases like the one that we see now. The next angle is also about the persistence factor. The longer the crude prices persists at elevated levels, more the impact- both on the economy and the markets. The fundamental underpinning for the above behaviour is most likely that within a normal supply-side environment, rising crude oil prices reflect a rising aggregate demand environment, which provide bullish signals for equities and vice versa.
However, oil above USD 100/bbl is a negative development, given:- India imports almost 90% of its annual crude oil requirement with a net oil import bill of ~USD 122bn in FY25 (3.1% of GDP).
- A 10% rise in crude oil price could increase it by ~USD 12bn (~ 0.3% of GDP). Overall, the external sector will likely be impacted the most, with pressure on the current account due to the trade deficit potentially widening amid amplified risks to remittances from the Gulf region while prompting FPI outflows. Thereby, impacting the overall BOP outlook as well.
- Also, it begins to negatively impact demand as prices rise. Corporate profitability is also impacted, as fuel and raw material costs for most companies surge.
- Spike in crude oil would also be inflationary, as the weight of petrol, diesel and LPG is higher in the new CPI series at 6.8% (3.6% in earlier series); although, the impact may depend on the extent of pass-through of global oil prices to domestic fuel prices.
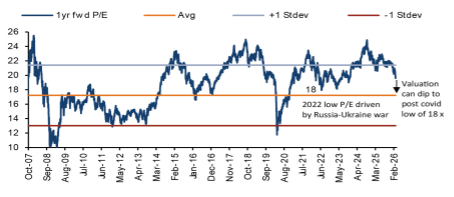
- A sharp increase in crude oil prices will put pressure on valuations. Valuations, currently in neutral range could correct to more attractive levels, providing investors a good entry level to markets, in our view
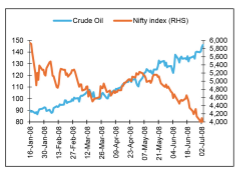
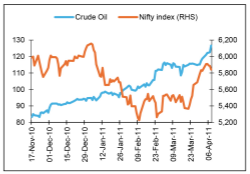
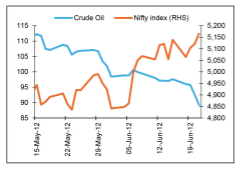
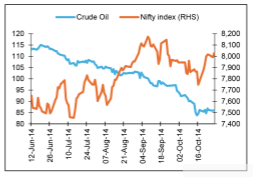
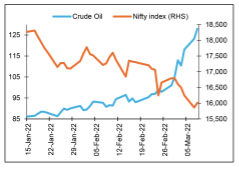
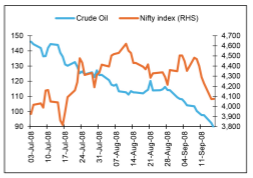
- In the past, temporary spike in crude oil prices has created buying opportunities. Last such instance of the negative correlation of crude prices and NIFTY50 was witnessed in 2022, when oil prices spiked beyond USD 100/bbl for 3–4 months driven by Russia’s invasion of Ukraine. The resulting volatility (NIFTY50 fell ~10%) created the conditions for an equity rally seen over CY23.
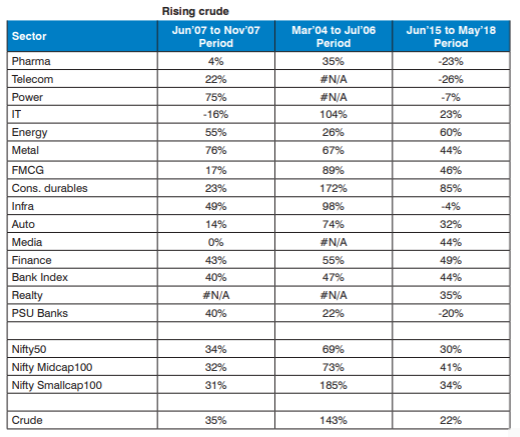
- At a broader market level, the impact is similar, just more magnified. That is mid cap and small caps tend to correct more than Nifty during such crises
At a sector level, higher beta sectors, like financials, auto, industrials experience sharper correction vs defensives. The current environment therefore warrants more defensive sector exposures, in our view.
Geostrategy and crystal ball gazingThe million dollar question that’s on everyone’s mind is “how long is this conflict likely?”. In this regard, the recent precedent of Russia-Ukraine conflict doesn’t offer any solace. The conflict that started in 2022 persists even today. No doubt, there are actors who would want such a scenario to play out in the current crisis too. However, there are some factors that point towards a quicker resolution are:
- Both US and China, the top 2 economies and super powers of the world are finding themselves on the same side of not wanting undue spike in oil prices. Given this there will be pressure on keeping this conflict from prolonging. The recent pronouncement from the US assuring that oil and gas fields wont be attacked is a pointer in this direction
- There is a direct correlation between increased energy prices and decline in GDP outputs. Also, there are second order effects and the fact that supply chains are not restored immediately after the conflict ends. Given this, if this conflict prolongs for more than 2-3 months, there is a real risk of economic recession in the global economy (2 quarters of economic contraction)
- While a conflict impacts markets negatively, sharp market corrections will force governments and conflict participants into negotiation table. At present Iran would like to drag this on for long enough to gain an upper hand in negotiations if/when they do happen. On the other hand, US and Israel would want an outcome in the shorter time frame to claim victory without affecting their respective economies, global economy and the respective political constituencies.
Annexure
History of Oil CrisisThe 1973–74 Oil Crisis:The first major modern oil price shock saw the price of WTI crude rise from US$4.31 per barrel in September 1973 to US$10.11 by January 1974. Although the Arab–Israeli war and the Arab oil embargo are often cited as triggers, global demand growth was a key factor during the 1973-74 oil price spike.
The 1979–80 Oil Crisis:The second major spike—an increase from less than US$15 in late 1978 to nearly US$40 by April 1980—did not follow the Iranian Revolution immediately. In fact, the biggest supply shortfalls occurred in early 1979, yet prices barely moved until May. The eventual surge was driven by two forces; a) inventory demand, as market participants feared future shortages amid geopolitical tension; and b) strong global economic performance, which raised flow demand for crude.
Supply shortfalls were largely offset by Saudi increases, which explains why oil prices did not rise immediately even as Iran’s production collapsed. The price shock was therefore rooted more in expectations of future scarcity than in contemporaneous supply contraction.
Early 1980s:Supply Disruptions with Modest Price Effects: The outbreak of the Iran–Iraq War in September 1980 caused a reduction in exports from both countries. Yet the price increase was surprisingly muted—from US$36 to US$38 per barrel over four months. This episode demonstrates that supply shocks do not always lead to major price spikes, especially when the global market is otherwise well supplied.
Mid‑1980s Collapse: Demand Weakness and Rising Non-OPEC Production: Following the 1980 peak, oil prices fell persistently through the early 1980s due to global recession triggered by tighter U.S. monetary policy, energy-efficiency improvements in advanced economies, newly expanding non-OPEC supply (Mexico, Norway, UK), and liquidation of oil inventories accumulated in 1979. Saudi Arabia attempted to support prices through unilateral production cuts but failed. When it reversed course in late 1985, the result was the dramatic 1986 oil price collapse, amplified by declining inventory demand as OPEC’s credibility eroded.
1990 Gulf War: Iraq’s invasion of Kuwait generated a substantial price spike, driven by actual supply losses from Kuwait and Iraq, and a surge in precautionary inventory demand, as markets feared an attack on Saudi Arabian fields. Once international forces moved to secure Saudi Arabia, these fears faded, leading to a rapid price decline—even though Kuwaiti and Iraqi production had not yet recovered. This episode illustrates how expectational shocks often dominate physical supply losses.
The 1997–98 Asian Financial Crisis:A Demand-Driven Collapse: By December 1998, WTI hit US$11 per barrel, a historic low. This plunge stemmed overwhelmingly from weak global demand, triggered by the Asian financial crisis and subsequent recessions in Russia, Brazil, and Argentina.
2003 Iraq War & Venezuelan Strikes:Why Prices Did Not Soar: Two large supply disruptions—civil unrest in Venezuela and the Iraq War—had surprisingly little effect on global oil prices. A temporary spike of only about US$6 per barrel occurred. The reason was that other producers offset the losses, and inventory demand remained modest because markets did not anticipate further shortages. This resilience highlights that geopolitical events alone do not guarantee large oil price increases.
2003–08 Great Oil Price Surge:Demand from Emerging Economies: From US$28 (2003) to US$134 (mid-2008), oil experienced its most dramatic sustained rise since the 1970s. This increase was driven almost entirely by strong, persistent global demand growth, especially from emerging Asia. Supply failed to keep pace,
2008 Financial Crisis: A Sudden Demand Collapse: As the global economy deteriorated rapidly in late 2008, industrial demand for commodities collapsed. Oil prices fell from $134 in June 2008 to $39 by February 2009. This is one of the clearest examples of a pure, sharp demand-driven crash, far exceeding the fall in global GDP because industrial activity is more volatile than aggregate output.
2011–2014: Stability Amid Shocks:Despite geopolitical disruptions such as Libya’s civil war (raising prices by US$3–US$13) and tensions with Iran (raising prices by US$0–US$9), global oil prices remained relatively stable near US$100 per barrel. The key moderating factor was the rapid expansion of U.S. shale oil, which created a supply cushion and even led to a persistent discount of WTI relative to Brent due to U.S. infrastructure bottlenecks.
2014–15 Oil Price Collapse:A Combination of Predictable and Unexpected Forces: The Brent price fell from US$112 (June 2014) to US$47 attributed to slowing economic activity, increases in expected and actual production of US Shale further amplified by reduced inventory demand
2020 Oil Price Collapse During COVID‑19: The COVID-19 pandemic triggered one of the most dramatic oil price collapses. On April 20, 2020, when the WTI May futures contract fell to –US$37 per barrel, marking the first time U.S. oil prices turned negative. Brent crude also plunged to US$9.12 per barrel the next day as global demand cratered. The collapse was compounded by a temporary Russia–Saudi Arabia price war, which had increased supply just as demand evaporated. As lockdowns eased and OPEC+ enacted deep production cuts, prices gradually recovered through mid-2020, supported later in the year by optimism over vaccine rollouts.
2022 Russia–Ukraine War: Oil Price Surge and Subsequent Fall: Russia’s invasion of Ukraine in February 2022 caused oil prices to surge sharply due to fears of supply disruption from one of the world’s largest oil exporters. On the day of the invasion, Brent crude surpassed US$100 per barrel for the first time since 2014, and quickly climbed above US$105, driven by expectations that sanctions and self-sanctioning by traders and refiners would limit Russian exports. However, as the months progressed, the actual impact on physical supply was smaller than initially feared. Russian oil continued to flow—often at steep discounts and redirected to markets like India and China—and financial workarounds enabled continued trade despite sanctions.
)
0bf21f855da944d2a0c843c4553297d8)