Section 3: Indian Macro
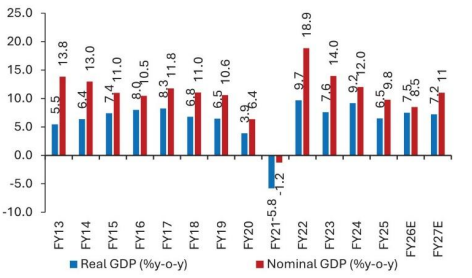
India’s 1H FY26 real GDP growth has averaged at 8% y-o-y
while the nominal GDP growth has been extremely soft at
8.8% y-o-y.
India’s economic activity had been soft in 1H FY26
Real GDP strength is at odds with modest growth in
several high-frequency indicators, including corporate
data. We maintain that Nominal GDP is the clearer
indicator of India’s economic pulse especially during
times when WPI is extremely low. Nominal growth,
presently, is much weaker than desired 11-12% (at the
very least).
High frequency indicators suggest a pick-up in activity
during November 2025
Looking beyond Q2, high-frequency indicators for
November show encouraging signs: a pickup in bank
credit, healthy services exports, freight activity
(likely aided by GST rate cuts and festive demand),
strong steel consumption, and resilient auto sales
especially for tractors, and passenger vehicles. Tax
collections have also improved in September and October
2025 (Exhibit 20).
Exhibit 20
High Frequency Indicators
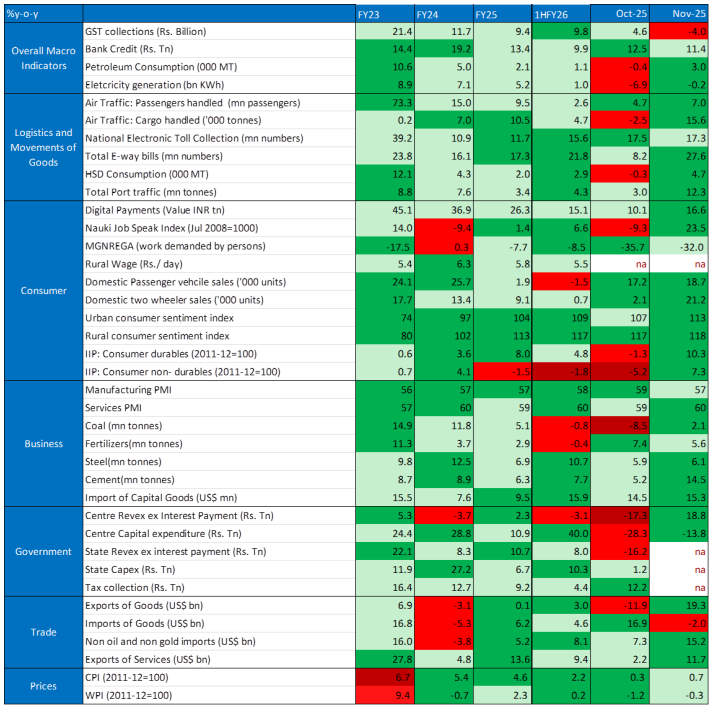 Source: CMIE, RBI, SBIFM Research; NB: Dark
green denotes positive and higher than previous month,
light green positive but moderation, light red is
negative but improvement, red is negative and
deterioration
Source: CMIE, RBI, SBIFM Research; NB: Dark
green denotes positive and higher than previous month,
light green positive but moderation, light red is
negative but improvement, red is negative and
deterioration
Statistical anomalies could distort the GDP prints in
FY26 and FY27, but…
Purely for deflator reasons, FY26 real GDP could clock a
growth of 7.5% y-o-y while nominal could be low at 8.5%.
For FY27, we are getting incrementally positive on
India’s growth outlook. As the low inflation tailwinds
will be behind us, real GDP growth could appear to be
moderating to 7.2% but we expect nominal growth to
improve to ~11% in FY27 (Exhibit 21). It is important to
note that Ministry of Statistics is planning to release
a new GDP CPI and IIP series which will see a base
revision and some methodological changes which might
require us to revisit the statistical prints.
Exhibit 21
India’s Nominal and Real GDP outlook
 Source CMIE, SBIFM Research
…more importantly, directionally, we are positive on
growth in FY27 backed by policy thrust
One of the most important reasons for us to get positive
is the change in policy outlook. Both fiscal and
monetary policy were growth restrictive in 2024, with
monetary policy fixated on inflation and regulatory
tightening while fiscal policy focused on tax buoyancy
and consolidation. This has meaningfully reversed in
2025.
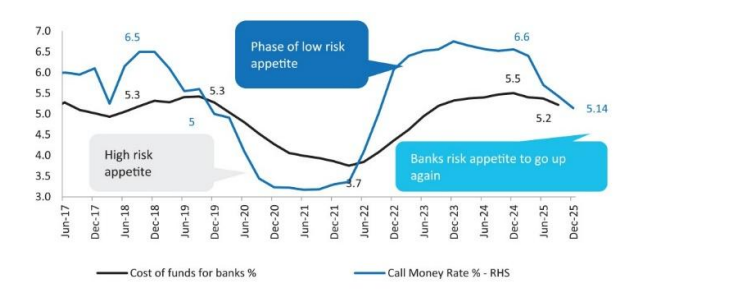
Monetary policy has shifted from risk aversion to growth
orientation in 2025
For banks, the regulatory stance has shifted from risk
aversion to growth orientation. Throughout 2025, there
has been tacit relaxation in credit-to-deposit ratio
norms, liquidity coverage ratio requirements, and
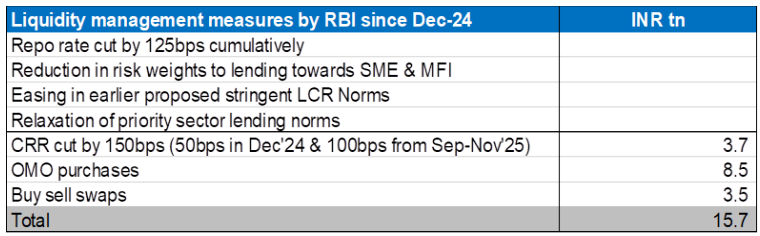
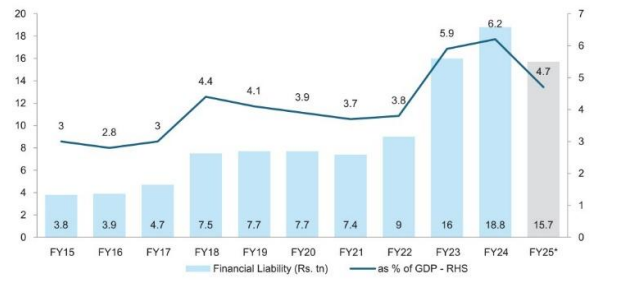
provisioning for unsecured loans. Repo rate has been
reduced by 125bps in 2025, and RBI has taken direct
liquidity infusion measures totaling to INR 15.7
trillion via OMO purchases, CRR reduction and FX swaps
and LCR relaxation since December 2024. Even as
liquidity had stayed lower than desired despite these
measures, the intent is quite clear- which is to keep
liquidity supportive.
Exhibit 22
Liquidity support by RBI since Dec’2024
 Source: RBI, SBIFM Research
From tax cuts to labour code: India’s reform surge in
2025
Further, the absence of a trade deal and the resurgence
of the current government’s popularity in multiple state
elections post-June 2025 appear to have catalyzed a
series of meaningful reforms during the year. The year
began with a reduction in personal income tax, followed
by GST rate rationalization, removal of quality control
orders in select sectors, implementation of the labour
code, 100% FDI in the insurance sector, permission for
private investment in the nuclear sector, and a revamp
of the employment guarantee scheme to enhance
efficiency. Overall, 2025 was a power-packed year for
reforms. It is also understood that several states have
become increasingly proactive in easing regulatory
bottlenecks to attract FDI, with Tamil Nadu setting a
notable example. While many of these reforms are
difficult to quantify in terms of their immediate growth
impact they undoubtedly contribute to a more
constructive outlook for India’s medium-term economic
story.
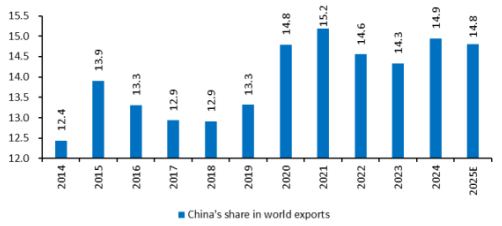
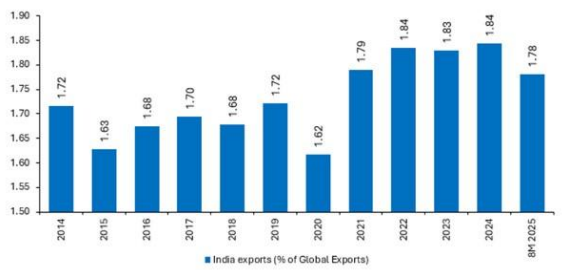
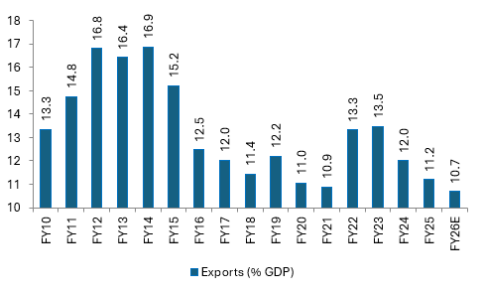
India’s Export Outlook: Waiting for Clarity Amid Trade
Deal Uncertainty
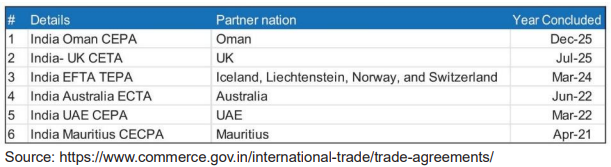
We remain hopeful that the India–US trade deal will
materialize in 2025, while India continues to sign free
trade agreements with other nations (Exhibit 23).
However, any export-related boost from such an agreement
is not factored into our current growth model, even
though it would likely improve sentiment around dollar
inflows and the rupee. At the same time, we are mindful
of rising competition from China, which continues to
capture a larger share of global trade, leaving India’s
market share stalled under 2% of GDP (Exhibit 24,25,26).
For now, we assume healthy services exports but a
subdued performance in goods exports. Interestingly,
November 2025 merchandise export data was surprisingly
strong, suggesting that India’s export dynamics have
remained resilient despite the 50% tariff imposed by the
US. Still, it would be prudent to wait for a few more
months before establishing a trend. It is too early to
conclude whether a trade deal would significantly boost
exports or, conversely, whether the absence of one would
lead to a meaningful decline. Given that US growth –
excluding AI-driven sectors – appears modest, and both
China and Europe lack significant momentum, we maintain
an unexciting outlook for India’s exports in 2026–27.
Exhibit 23
Bilateral Trade Agreements post COVID
 Source: RBI, SBIFM Research
Exhibit 24
China continues to grab global trade share
 Source: Bloomberg, SBIFM Research
Exhibit 25
China’s exports ex of US surges
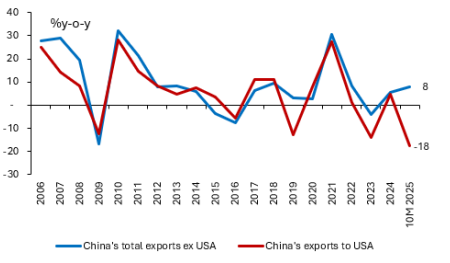
Exhibit 26
India’s global trade share has fallen in 2025
 Source: Bloomberg, SBIFM Research
Hence, growth will clearly by shaped by domestic forces.
Credit led growth recovery in cards
A true yardstick for success stories of government
reforms would be measured in the form of bank credit,
improvement in India’s manufacturing share to GDP,
formalization of labour force and increased FDI in
India. One of them has already started to improve.
Bank credit which has improved from 9% in May 2025 to
11.5% by end November 2025 (Exhibit 27). We expect it to
further improve to 13-14% in FY27. Adding up the other
avenues of credit (NCDs, CPs and ECBs), aggregate credit
could improve to 12% in FY27 compared to a likely 10.5-
11% in FY26 and 11% during FY24 and FY25. This should at
least drive a nominal GDP growth higher to 10- 11% in
FY27. As the profit accruals of corporates stay strong,
household credit growth could likely outpace the
corporate credit growth.
Exhibit 27
Bank credit growth and aggregate credit growth
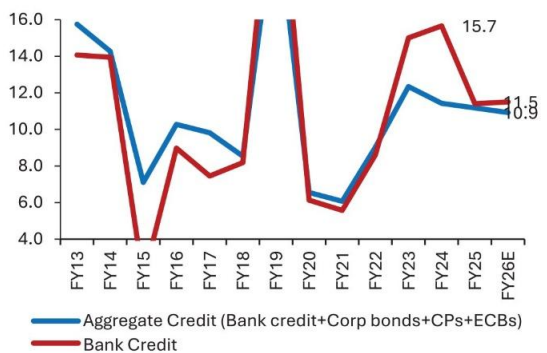 Source: CMIE, RBI, SBIFM Research
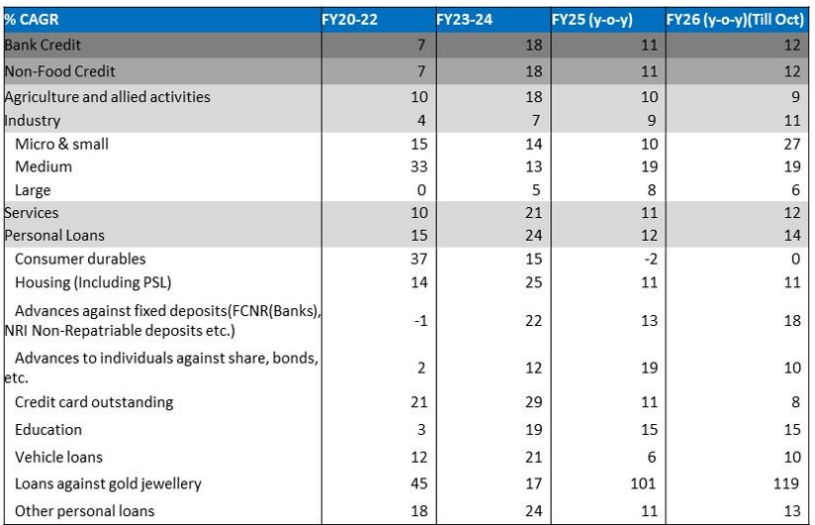
Exhibit 28
Break-up of bank credit
 Source: CMIE, SBIFM Research
A pick-up in credit, contained inflation, government
supportive measures along with a decent income backdrop
should aid consumption recovery
Constructive outlook on FY27 consumption; Segments
thriving on credit-led demand could outperform
We remain optimistic about consumption demand in FY27,
supported by stronger credit flows, contained inflation,
and the sustained impact of multiple government
initiatives. While personal loan growth was robust in
FY23 and FY24 (21% and 28%, respectively), consumption
remained muted as credit was largely used to offset
COVID-induced income stress. This time, with a healthier
income backdrop, improved credit availability is
expected to translate into stronger consumption.
Segments that thrive on credit-driven demand could
perform particularly well in FY27.
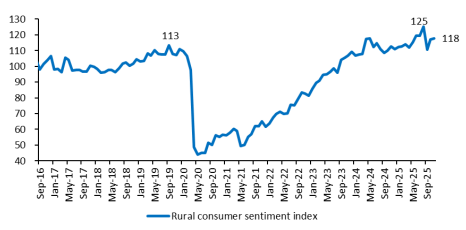
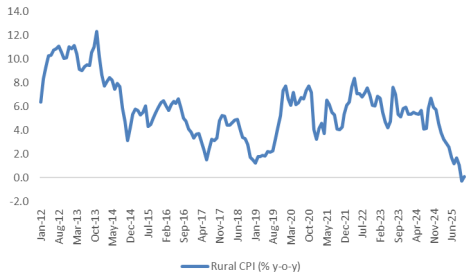
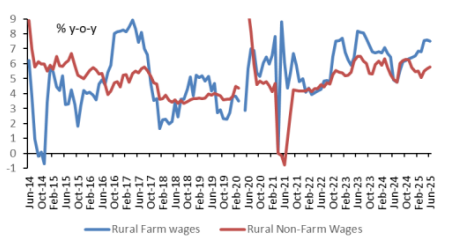
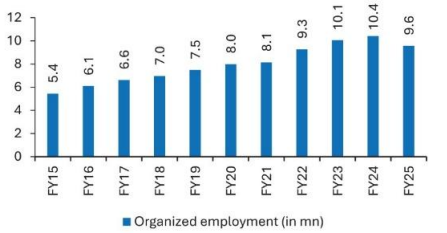
Rural spending outlook positive as welfare measures and
low inflation mitigate kharif income setback
Further, state welfare schemes, combined with easing
inflation and improving wage growth, have boosted rural
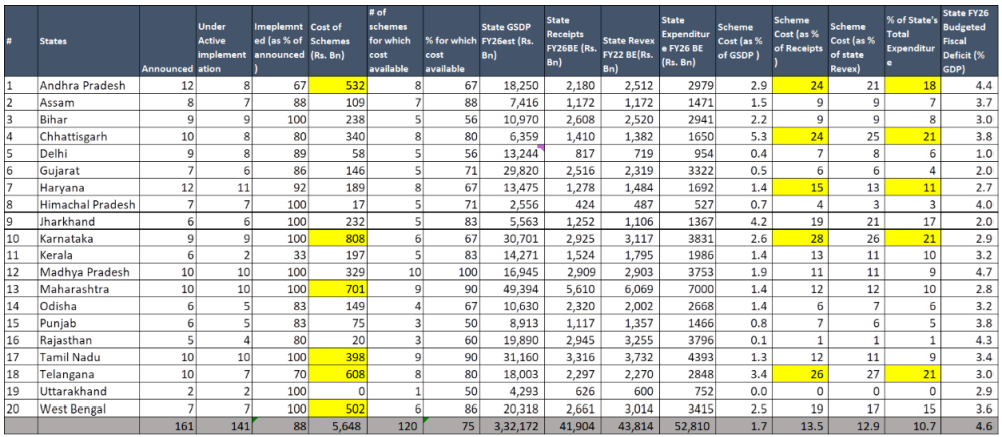
consumer sentiment (Exhibit 29 to 32). The welfare
schemes primarily target women, farmers, senior
citizens, and the unemployed, with free or subsidized
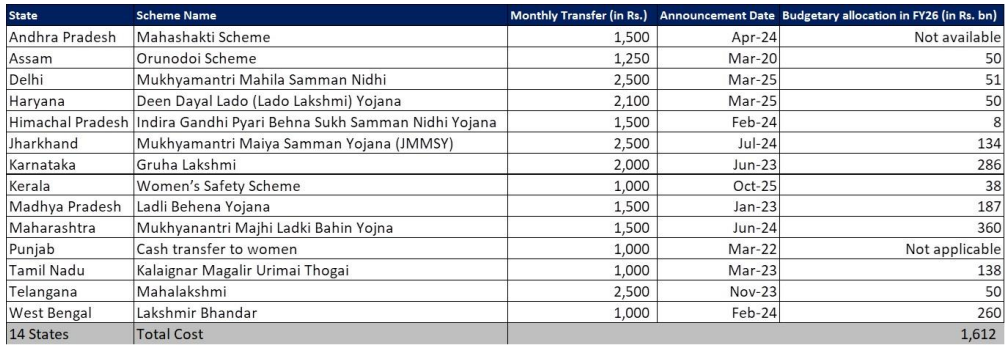
electricity and LPG are also becoming widespread. 14
states are offering unconditional cash transfers to
women in FY26. While it is often argued that these
schemes merely reallocate revenue expenditure and hence
are not truly income supportive. However, we think that
they represent direct cash transfers and carry
significant political visibility, making
non-implementation difficult. Hence, even as there has
been a mere rejuggling of revenue expenditure, this is
more direct in nature and enables better cash inflow to
low-income households (Exhibit 33 to 35).
Exhibit 29
CMIE Rural consumer sentiment index is healthy
 Source: CMIE Rural consumer sentiment index
is healthy
Source: CMIE Rural consumer sentiment index
is healthy
Exhibit 30
Rural CPI inflation is at an all-time low
 Source: CMIE, SBIFM Research
Exhibit 31
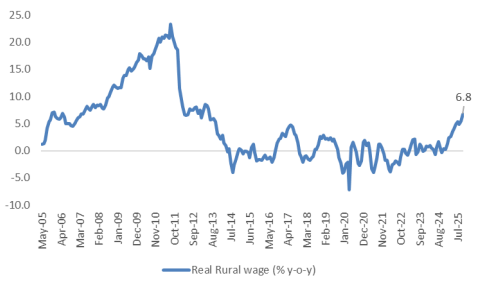
Rural wage growth sees modest improvement
 Source: CMIE, SBIFM Research
Exhibit 32
Wage growth in real terms is at the highest level
since 2013
 Source: CMIE, SBIFM Research
Exhibit 33
Welfare schemes account for 11% of expenditure and
13.5% of receipts across states; High welfare outlay
in Andhra Pradesh, Karnataka, Maharashtra, Tamil Nadu,
Telangana, West Bengal
 Source: State budget documents, media
resources, CMIE, SBIFM Research
Source: State budget documents, media
resources, CMIE, SBIFM Research
Exhibit 34
4 States have monthly income transfer schemes for
women ranging from Rs. 1000-2500 per month; entails an
annual cost of Rs. 1.6 trillion
 Source: State budget documents, media
resources, SBIFM Research
Source: State budget documents, media
resources, SBIFM Research
Exhibit 35
States rejig revenue expenses to accommodate the
welfare expenses
 Source: CMIE, SBIFM Research
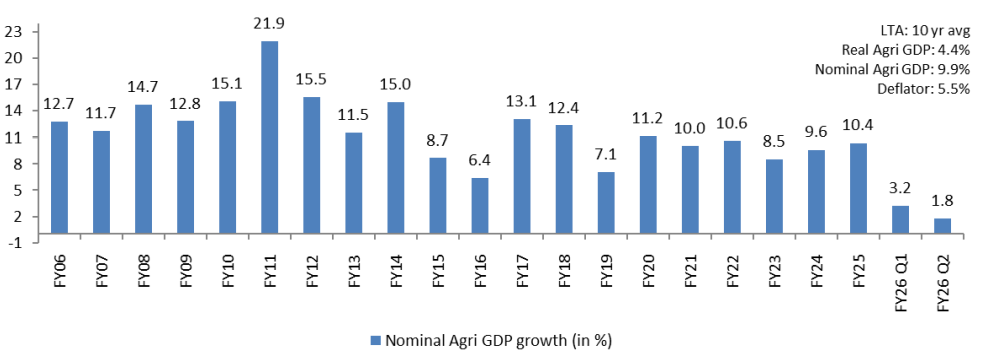
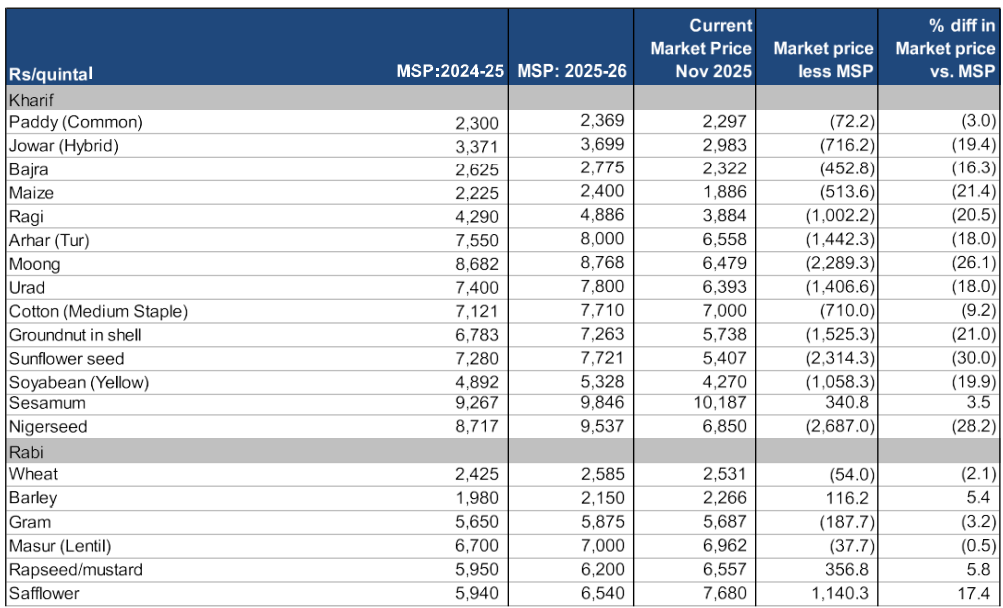
Yet, one adverse development stands out: Kharif income
has weakened this season due to unseasonal rains
affecting yields, especially for oilseeds and pulses.
Despite strong inventories, prices have fallen below
MSPs for most food grains, even compared to last year’s
MSP levels (Exhibit 36,37,38). While farmers may
withstand one weak season after two bumper years,
sectors reliant on farm income—such as two-wheelers,
fertilizers, and tractors—could face headwinds.
Encouragingly, Rabi sowing is progressing well.
Exhibit 36
Agri and allied income growth one of the lowest since
FY06.
 Source: CMIE, SBIFM Research
Exhibit 37
Sharp decline in agri prices in FY25-26
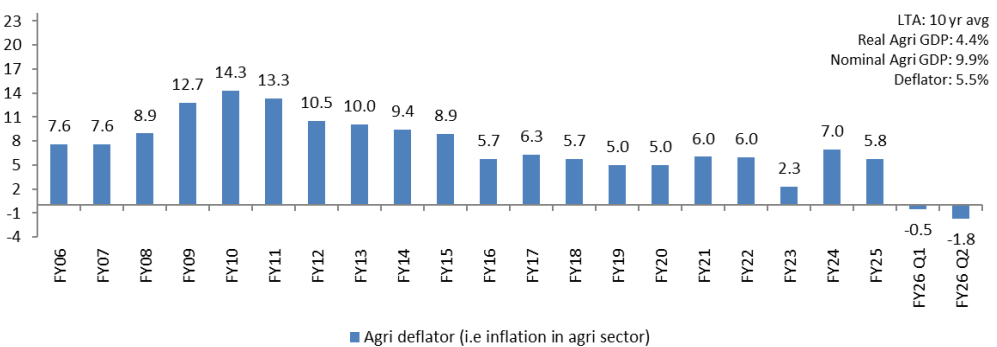 Source: CMIE, SBIFM Research
Exhibit 38
Prices of all the crops are trading below their MSP.
For Kharif crops, their current prices are even below
2024 MSP
 Source: CMIE, SBIFM Research
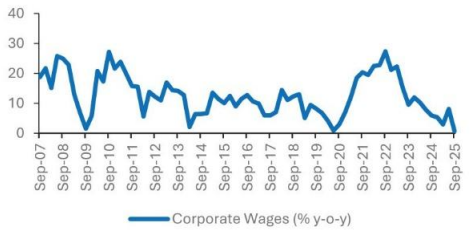
Urban consumption outlook: cautious but improving
Urban households have faced headwinds from moderating
corporate wages and reduced hiring in banks and IT since
FY25. However, if overall economic growth strengthens,
hiring activity should pick up, improving the outlook
for urban consumption demand.
Exhibit 39
Corporate wage growth
 Source: CMIE, SBIFM Research
Exhibit 40
Hiring falls in financial sector and IT
 Source: Ace Equity, Capitaline, SBIFM
Research
Source: Ace Equity, Capitaline, SBIFM
Research
Premiumization: a structural consumption theme
While we often bucket consumption trends into rural and
urban segments, one theme stands out as a structural
play—premiumization. Rising middle-class incomes,
demographic dividends, a large population base, and
growth outpacing most global peers have provided a
strong backdrop for this trend. Premiumization of the
consumption basket is likely to remain a key driver in
the medium to long term.
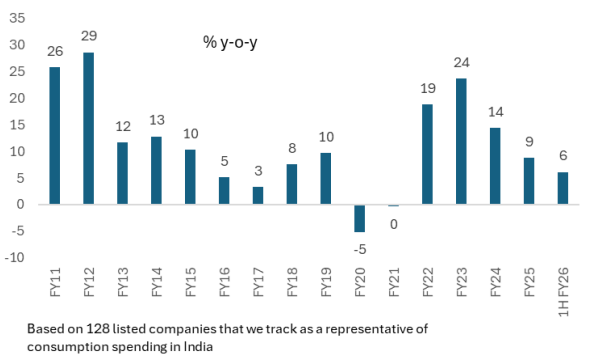
Exhibit 41
Consumption spending has been moderating since FY25
 Source: Ace Equity, SBIFM Research
Consumption spending has been moderating since FY25 (E x
h i b i t 41). However, we find that segments associated
with premium consumption have depicted much stronger
growth (Exhibit 42).
Exhibit 42
Stronger sales in Jewellery, E-commerce, QSR, Retail
and telecom relative to other sectors
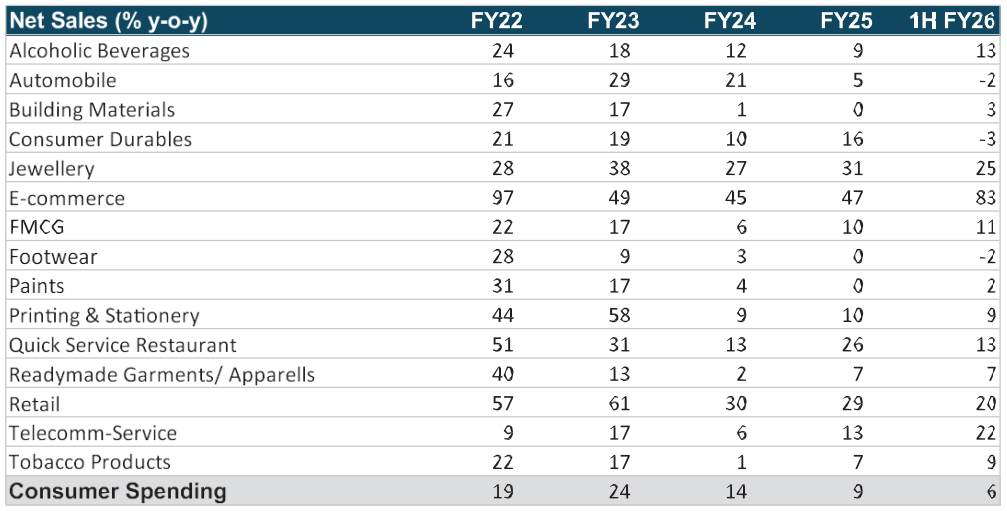 Source: Ace Equity, SBIFM Research: NB: Based
on 128 listed companies that we track as a
representative of consumption spending in India
Source: Ace Equity, SBIFM Research: NB: Based
on 128 listed companies that we track as a
representative of consumption spending in India
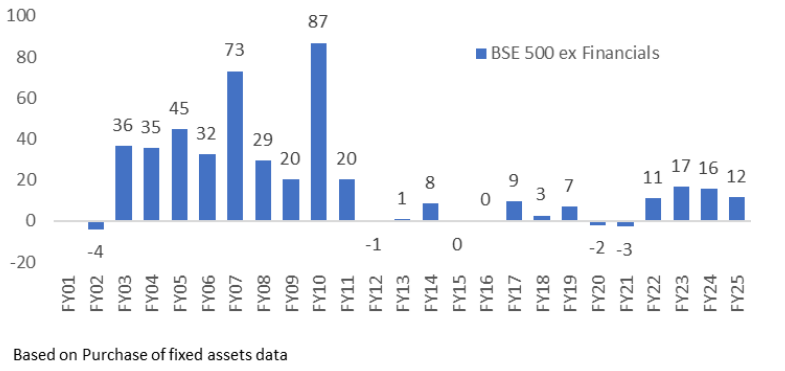
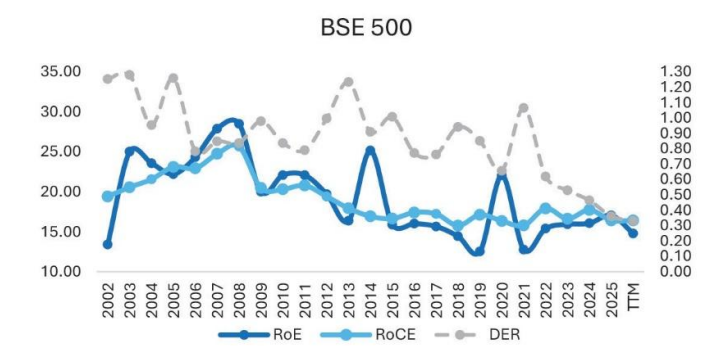
Corporate capex has been healthy
BSE 500 ex financials capex has expanded by 12% in FY25
vs. 16% in FY24 (Exhibit 43). Two third of the capex
comes from power and gas sectors. As per our assessment,
the capex growth has likely continued to be in mid-teens
in FY26 and will further expand by 10-12% in FY27. We
believe the real estate and power-generation cycles
remain in good health.
The capex outlook is also positive for renewables, data
centre, and cement sector in India. There is a vision to
increase data centre capacity from current 1-1.2GW to
3GW over the next four years which would entail a capex
outgo of Rs. 1-1.2 trillion over the period. A healthy
growth in the urban India housing (which accounts for
12-15% of cement demand) compared to an extremely muted
real estate activity for most part of last decade, is
the key factor driving a pick-up on cement demand and
there by capacity utilization while other segments of
demand continue to hold a healthy pace. While auto and
textile sector companies have retained the capex
guidance, if the India US trade deal stays stuck even in
2026, it could pose some downside risks to the capacity
addition in these sectors. On the other hand, capex
outlook for Oil & Gas, Chemicals and Sugar sector
appears weak owing to heavy capex activity in the oil &
Gas sector in recent years, the overhang of Chinese
dumping in the chemicals sector and completion of
sufficient ethanol plant addition in the sugar sector.
Exhibit 43
BSE 500: Capex activity shows double digit growth
since FY22
 Source: Ace Equity, SBIFM Research
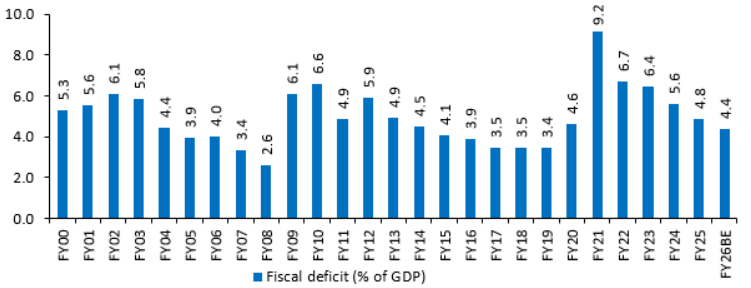
Central government capex commitment is likely to be in
line with Nominal GDP growth as the pace of fiscal
consolidation likely moderates
Over the past three years, the central government has
reduced its fiscal deficit by 2 percentage points—from
6.4% in FY23 to a likely 4.4% by FY26 (Exhibit 44).
Exhibit 44
Centre’s fiscal deficit
 Source: CMIE, SBIFM Research
Consequently, after a near tripling of capex outgo from
Rs. 3.3 trillion in FY20 to Rs. 9.5 trillion by FY24
(partly due to the absorption of off-balance-sheet capex
into the main budget), the strong infrastructure push
led by the central government has since cooled. We are
given to understand that more than the funding
constraints, execution challenges have been at the front
foot of moderating infrastructure activities in India
over last three years
Looking ahead in FY27, we do not expect any material
change in infrastructure outlook. On a positive note,
the pace of consolidation will likely come down to 20bps
in FY27. Better growth should drive an improvement in
tax buoyancy in FY27. We estimate Centre’s capex
commitment to be in line with Nominal GDP growth.
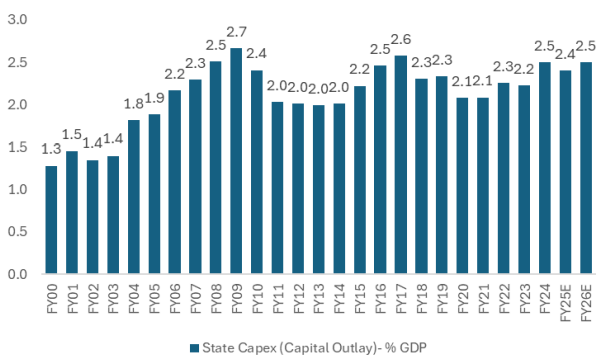
State capital outlay has been intact at 2.4-2.5% of GDP
While it is true that implementation of state welfare
schemes and lack of revenue buoyancy in states’ finances
has led to widening of state deficit from 2.5% of GDP
(FY18–FY20) to 3.2–3.5% in FY25–FY26, state capital
outlay has largely remained stable, ranging between 2.2%
and 2.4% of GDP from FY15 to FY25 (Exhibit 45).
This resilience is partly due to the 50-year
interest-free capex loans offered under the Scheme for
Special Assistance to States for Capital Investment
(SASCI) since FY21. These loans, outside the normal
borrowing limit, have grown from Rs. 120 billion in FY21
to an estimated Rs. 1,500 billion in FY26, financing 19%
of states’ capital outlay in FY25 compared to 2.9% in
FY21. While states’ own capital spending effort
(excluding SASCI loans) has remained relatively stable,
central assistance has given a boost to capital
expenditure. In 2024-25, several states have estimated
to finance more than 25% of capital outlay through these
loans.
Exhibit 45
State capex remains intact despite welfare spending
 Source: CMIE, SBIFM Research
To sum it all, consumption demand appears to be the key
driver of improved growth in FY27 while the growth
momentum in corporate capex and infrastructure activity
could be similar to FY26. We are least constructive on
exports. Impact of any trade deal remains unclear for
now as competition from China is fierce and risks to
global growth and geopolitics continues to be a key
downside risk for FY27 too.
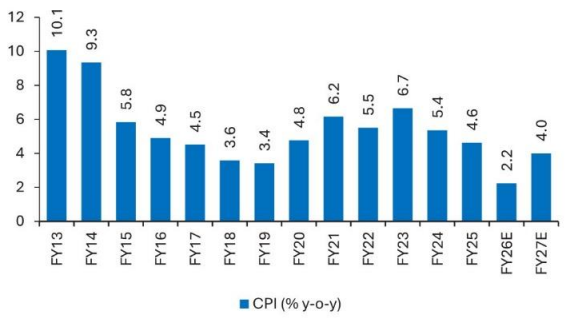
Inflation outlook: benign but rising in FY27
We expect inflation to average around 4% in FY27, up
from sub-2% levels likely in FY26—marking two
consecutive years below or at RBI’s 4% target. Inflation
is expected to move above 4% only by October next year,
largely due to base effects (Exhibit 46).
Exhibit 46
CPI outlook benign for FY27
 Source: CMIE, SBIFM Research
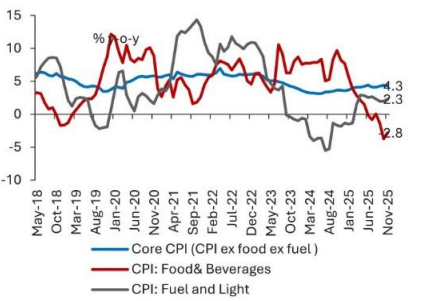
Cyclically, this benign inflation environment reflects
several factors: capped food inflation from continued
positive supply shocks, low commodity input costs,
moderating wage growth, and further transmission of GST
cuts to prices from October. Structurally, efficiency
and productivity gains from infrastructure investment
and increased digital transactions have also played a
role. Additionally, anchored inflation expectations
under the inflation-targeting regime, proactive
government supplyside measures, and heightened
competition from Chinese imports have contributed to
this trend (Exhibit 47 to 50).
Exhibit 47
Food inflation to likely mean revert in FY27
 Source: CMIE, SBIFM Research
Exhibit 48
Transportation cost unchanged in last 42 months
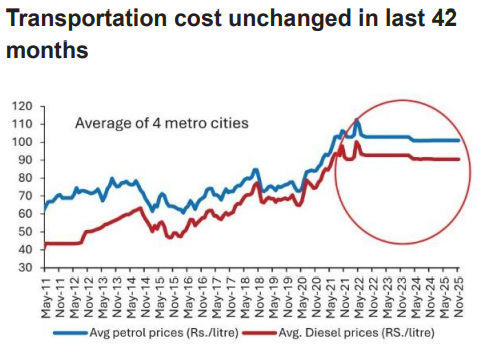 Source: CMIE, SBIFM Research
Exhibit 49
Annual WPI inflation
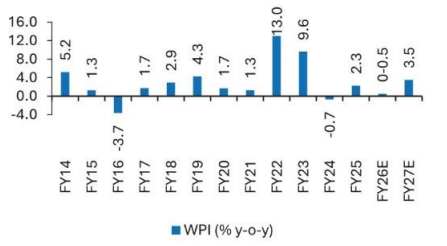 Source: CMIE, SBIFM Research
Exhibit 50
WPI inflation and CPI goods inflation correlated
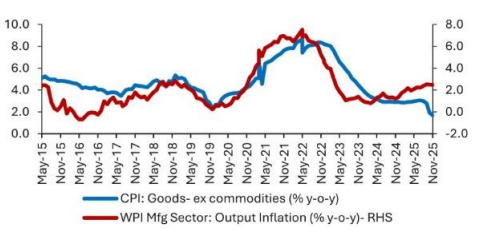 Source: CMIE, SBIFM Research
Monetary policy to stay supportive – liquidity actions
at the fore
While we would not rule out one more rate cut in 2026,
monetary policy in India is likely headed for a long
pause (unless global growth outlook deteriorates).
Liquidity, however, would continue to stay supportive
and we expect continued liquidity infusion into the
early parts of 2026
Centre on the path of modest fiscal consolidation; state
fiscal has deteriorated
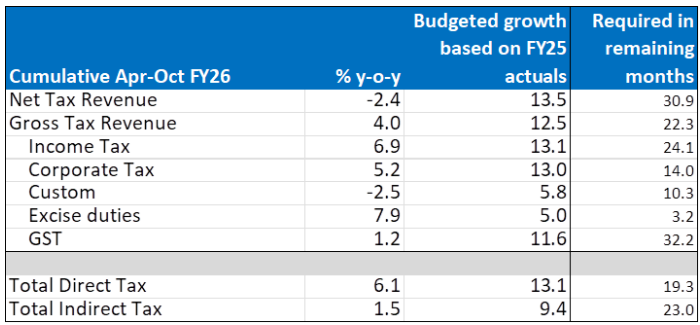
We expect Centre to stick to 4.4% of fiscal deficit
target in FY26. Direct tax collections improved in
October’25 (42% y-o-y) while indirect taxes declined
-5.7% y-o-y. Despite this, total 7M gross tax collection
has grown by 4% y-o-y. It is required to grow by 22% in
remaining 5 months to meet the budgeted targets (Exhibit
51). Indirect taxes could stay weak as GST effect also
creeps in 2H FY26. We estimate that overall tax revenue
could miss the budgeted target by Rs. 1.5 trillion. A
part of this will be offset by improved dividend
collection. Overall receipt shortfall is estimated at
0.2% of GDP which is manageable by minor expenditure
adjustment. We expect a modest consolidation to 4.2% of
GDP in FY27 implying a gross and net G-sec supply of Rs.
15.5 trillion and 11.5 trillion, respectively.
Exhibit 51
Gross tax collection likely to fall short of the
requited 22% in remaining 5M FY26 to meet budgeted
targets
 Source: CMIE, SBIFM Research
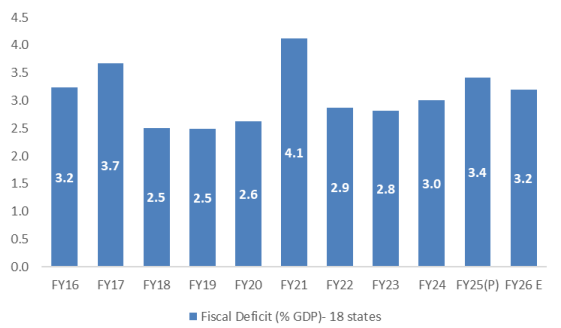
On the other hand, state finances have been
deteriorating. State fiscal deficits have risen—from
2.5% of GDP (FY18–FY20) to 3.2–3.5% in FY25–FY26—amid
falling receipts and higher welfare spending (Exhibit
52, 53, 54). The RBI (2024) cautioned that rising
expenditure on subsidies and cash transfers to farmers,
youth, and women could strain state finances,
recommending rationalization to preserve space for
productive spending. Given that these schemes carry
significant political visibility, non- implementation
would be increasingly difficult. Further, there are
impending problems with multiple state DISCOMS too which
must be addressed sooner than later.
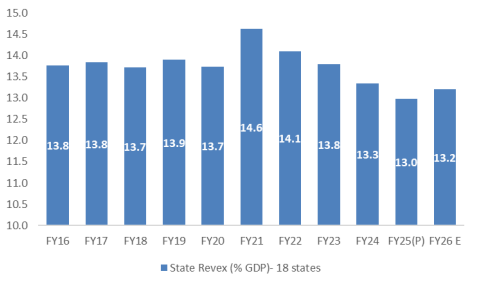
Exhibit 52
Despite capex loan, the flow of receipts to states has
moderated during FY24-26
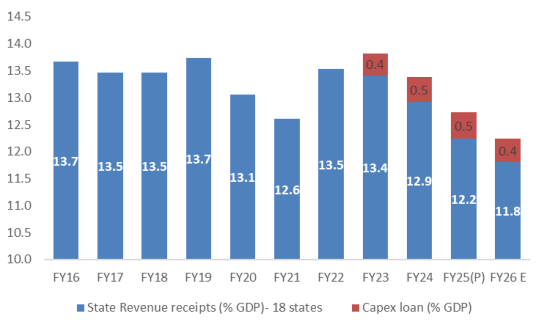 Source: CMIE, SBIFM Research
Exhibit 53
Reduced receipts and welfare measures have driven
state deficit to 3.2-3.4% of GDP during FY25- FY26
from 2.8% during FY22-23 and 2.5% during FY18-19.
 Source: CMIE, SBIFM Research
Exhibit 54
So far, states are rejigging their revenue expenses to
accommodate the welfare expenses
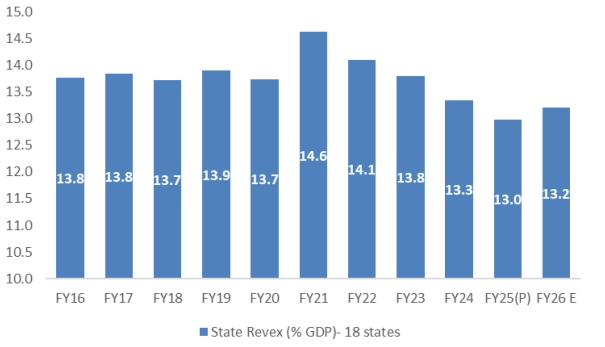 Source: CMIE, SBIFM Research
Regulations and capex loan keep state borrowing under
check
Even as state fiscal deficits are rising, a part of this
is getting funded by Centre’s capex loan. Further,
regulatory limits on states’ borrowing have also helped
to keep overall state fiscal deficit in check and forced
states to rejuggle their expenses and accommodate the
rise in scheme-based expenditure.
Government bonds supply could rise to Rs. 29 trillion in
FY27 (vs. Rs. 27.2 trillion in FY26)
In FY26, budgeted gross SDL had jumped by 16% to Rs.
12.4 trillion (most likely will go through). In FY27, we
expect net and gross SDL borrowing to rise to Rs. 9.5
trillion (vs. Rs. 8.7 trillion in FY26) and gross supply
to rise to Rs. 13.5 trillion. To sum, the overall supply
of government securities is estimated to rise to Rs. 29
trillion in FY27 against an estimated Rs. 27.2 trillion
in FY26.
Government bonds’ demand supply dynamics continues to
stay in a tight spot in FY27
Even as a likely inclusion of India in Bloomberg
Aggregate Index and resumption of NPS buying in FY27
appears to be a positive thrust, the demand supply
equation for government bond stays in a tight spot.
Improving credit growth in the banking system amid
elevated credit to deposit ratio would keep banks’ SLR
investment under check. Further, RBI has conducted Rs.
3.7 trillion of OMO purchase between Apr-Dec 2025 and
more could be in the offing in Q4 FY26. We are not sure
if liquidity dynamics would necessitate a similar OMO
action in FY27 (Exhibit 55).
Exhibit 55
Government bond demand supply
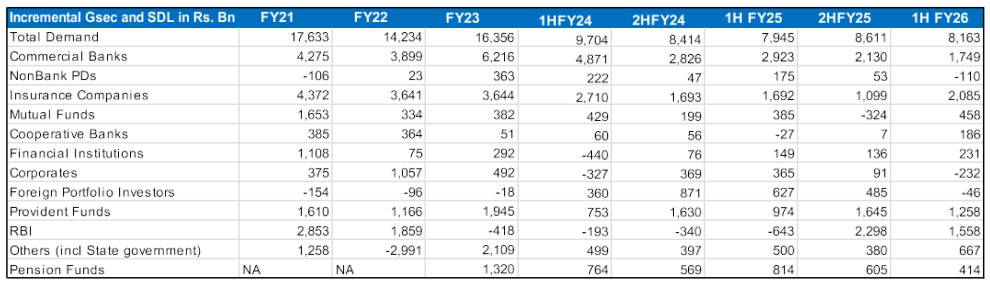 Source: RBI, SBIFM Research
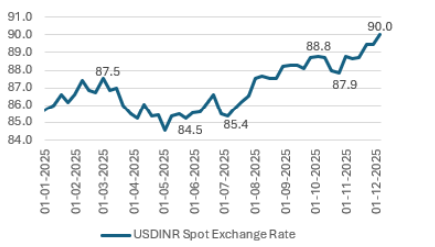
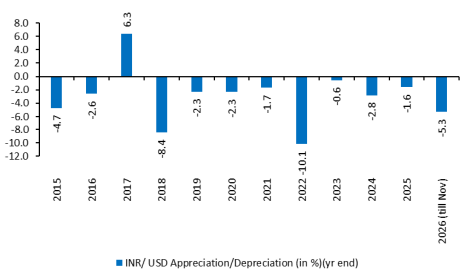
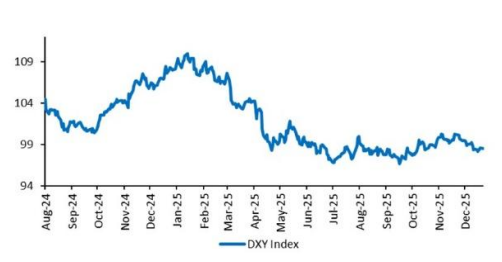
Rupee has been the focal point in 2025- depreciating
nearly 5% in 2025
The Indian rupee witnessed significant depreciation in
November, marking its sharpest pace of decline since
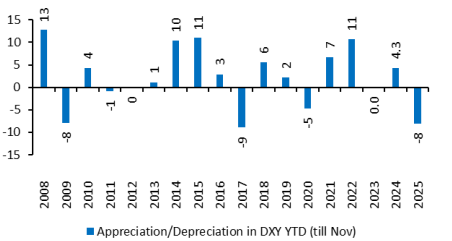
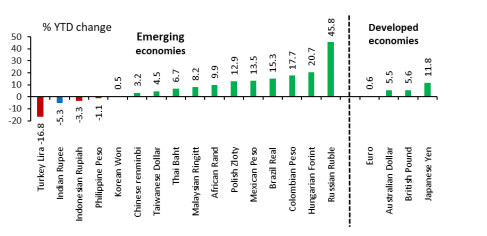
2022 (Exhibit 56 and 57). Interestingly, this weakness
has unfolded despite the U.S. dollar index (DXY) showing
an 8% decline and most emerging market currencies,
except Indonesia and Türkiye, appreciating against the
dollar. Typically, India’s lower inflation relative to
the U.S., stable crude prices, fiscal discipline, and
Current account deficit under 1% of GDP support Indian
assets and the rupee.
Exhibit 56
Rupee moves in 2025
 Source: Bloomberg, SBIFM Research
Exhibit 57
Sharpest depreciation in rupee since 2022
 Source: Bloomberg, SBIFM Research
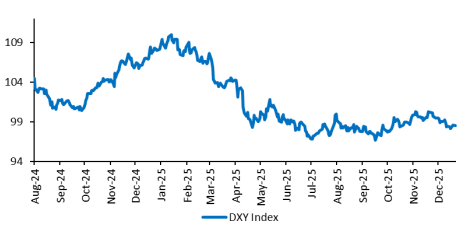
Exhibit 58
Dollar on a weakening bias
 Source: Bloomberg, SBIFM Research
Exhibit 59
Rupee underperforms relative to EM peers
 Source: Bloomberg, SBIFM Research
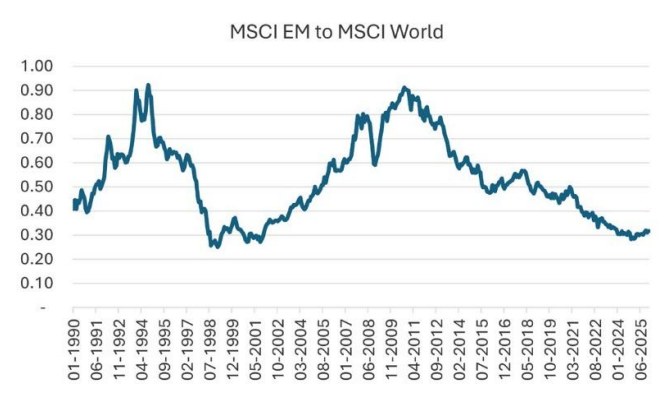
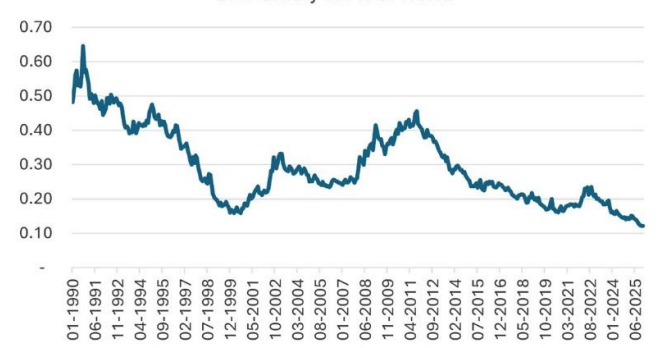
No trade deal at the helm of this mayhem
While India’s overall GDP growth appears to be largely
cushioned and minimally impacted by reduced exports to
the US, it is clearly impacting the external account and
hence sentiment around Rupee. Weak trade dynamics and
earnings downgrades are weighing on rupee sentiment.
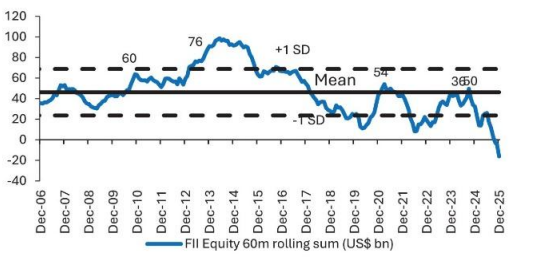
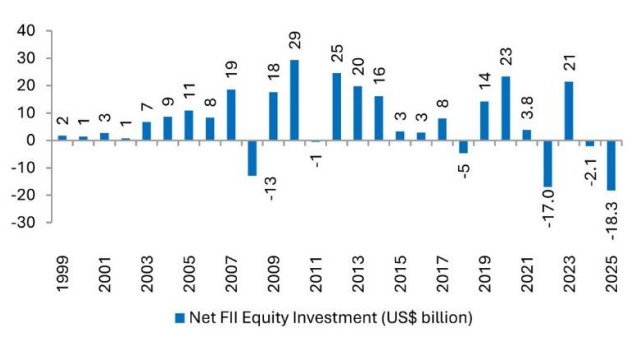
Indian exports are up 4% y-o-y FYTD, while global
exports rise. FPI flows remain muted, owing to the
combination of earnings downgrades, lack of AI plays and
no positive developments around trade deal (Exhibit 60).
India’s MSCI weight has slipped to third place after
nearly overtaking China last year. Thus, India’s
external account struggle has been more on the capital
inflow side which has not been even enough to cover up
for this muted CAD.
Exhibit 60
FII outflow should see a turnaround in FY27
 Source: Bloomberg, SBIFM Research
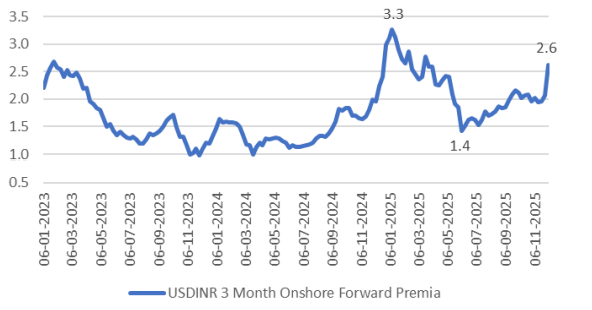
From Forward to Spot: Hedging Rush and Rising Premiums
Weakening sentiment around rupee triggered panic among
importers, prompting a rush to hedge future dollar
liabilities. This surge in hedging demand has pushed up
forward premiums in India. The 3-month dollar forwards
premium now stands at 2.6%, up from 1.4% six months ago
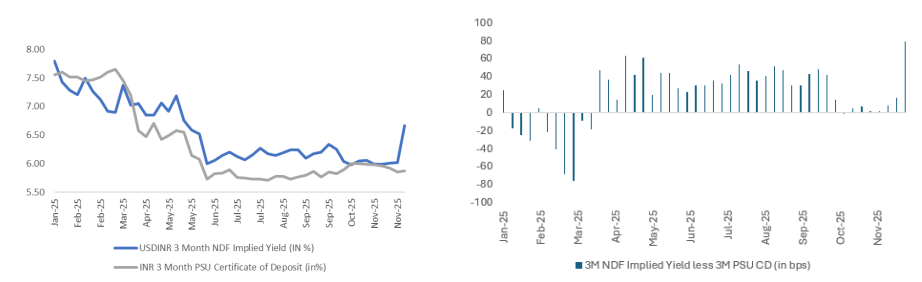
(Exhibit 61). Consequently, 3M INR implied yield (i.e.,
selling rupee and investing in dollar adjusted for the
hedging cost) offer an annualized return of roughly 6.70
%, (vs. 6% six months ago) compared to Indian PSU CDs
yielding 6.05% for similar tenors (CDs have been at
similar levels since Jun’25). This 90bps differential
effectively caps downward adjustment in onshore short
end rupee assets (Exhibit 62). To add, relaxation in RBI
rules are also leading exporters to delay in
repatriating their dollar earnings back to India.
Exhibit 61
Dollar forward premia jumps
 Source: Bloomberg, SBIFM Research
Exhibit 62
Sharp arbitrage opportunity between Indian CD’s and
NDF Implied yield
 Source: Bloomberg, SBIFM Research
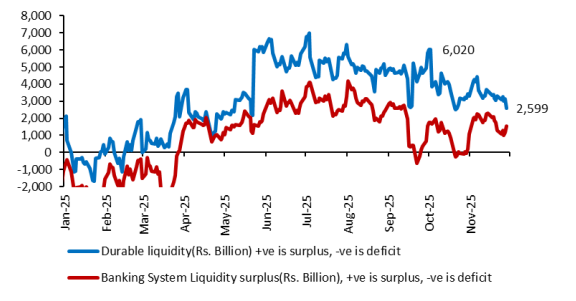
Exhibit 63
Banking System liquidity falls substantially due to
dollar capital outflow
 Source: Bloomberg, SBIFM Research
Impact on Domestic Markets
The dollar squeeze has led to increased selloffs in
Indian assets, reduced INR liquidity in the system, and
a rise in buy-sell swaps by private players. Forward
market stress is spilling over into spot rates because
of arbitrage opportunities. Despite a 100bps CRR cut
during September to Nov’25, durable banking system
liquidity has fallen from 5-6 trillion during July’25 to
2.6 trillion by end November (Exhibit 63).
At equilibrium, returns on rupee assets equal returns on
dollar assets plus hedging cost. Currently, rupee
returns are lower than this benchmark, creating
persistent pressure. To restore balance, one of the
following must occur: U.S. Treasury yields decline,
hedging costs fall, or Indian fixed-income yields rise.
This is partially happening. Despite a 25bps repo rate
cut and a Rs.1.45 trillion-rupee liquidity injection
announced in December MPC meet, Indian yields have
firmed. 10-year G-sec is up 10–12bps and three-month CDs
up 15–16bps. Thus, monetary easing since June has not
led to similar transmission in market rates (despite an
ultra-low inflation). Position unwinding by FPI’s
(reducing EM risk) leading to rise in offshore NDOIS
spilling over to onshore swaps have led to up move in
domestic yields, particularly since November. At the
same time, the market continues to grapple with Rupee
dynamics, alongside weak demand for sovereign assets due
to regulatory and taxation changes.
A durable solution requires either a meaningful shift in
rupee sentiment or RBI intervention via continued OMO
purchases. Our assessment suggests RBI may need to
inject an additional Rs. 2 trillion rupees over the next
three months to maintain LAF near 1% of NDTL. Now the
currency woes suggest that these liquidity actions could
come increasingly in the form of buy sell swap rather
than OMO purchases. This has been another reason to lead
to some adverse movement in G-sec yields in past one
week.
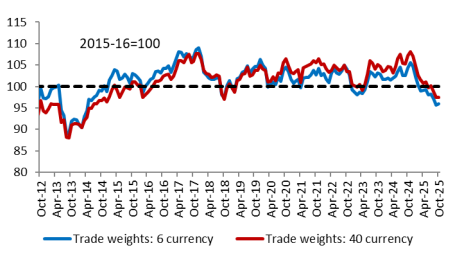
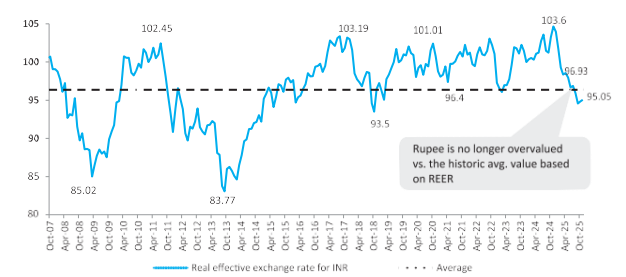
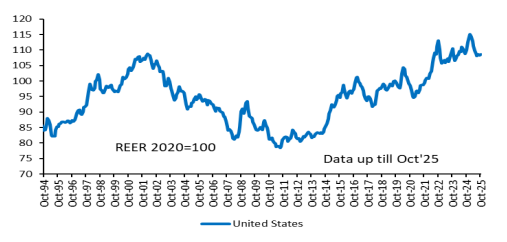
We are not meaningfully worried on Rupee
The INR’s recent weakness despite low inflation has
brought the REER to competitive levels. We do not see an
unduly stressed Balance-of-Payments. The impact of the
surge in investor demand for gold, which is keeping
import volumes high despite 50% higher prices is offset
by weak oil prices. A higher non-oil/gold deficit due to
a recovering economy and Chinese competition in export
markets can be paid for by the continuing double-digit
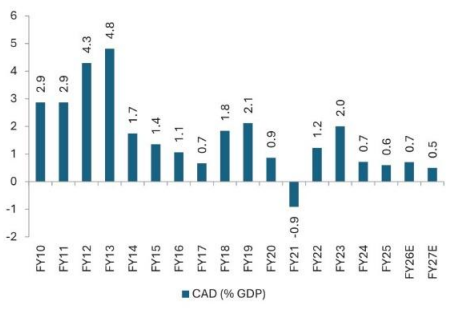
growth in net services exports. We expect the current
account deficit to stay contained under 1% of GDP in
FY26 and FY27. More importantly, we expect capital
inflow to improve in FY27 on the hopes of India’s
inclusion in another global bond indices. Further
overall FPI inflows in equity has reached to a level
where one can expect some resumption in equity purchases
by the foreigners. To sum, after ~5% depreciation in
2025 and ~4% depreciation FYTD, we expect rupee to
depreciate by a mere 2% in FY27 (i.e., 92/US$). In case
of a trade deal, we would not be surprised if Rupee
appreciates around the deal announcement (Exhibit 64 to
70).
Exhibit 64
BoP Outlook
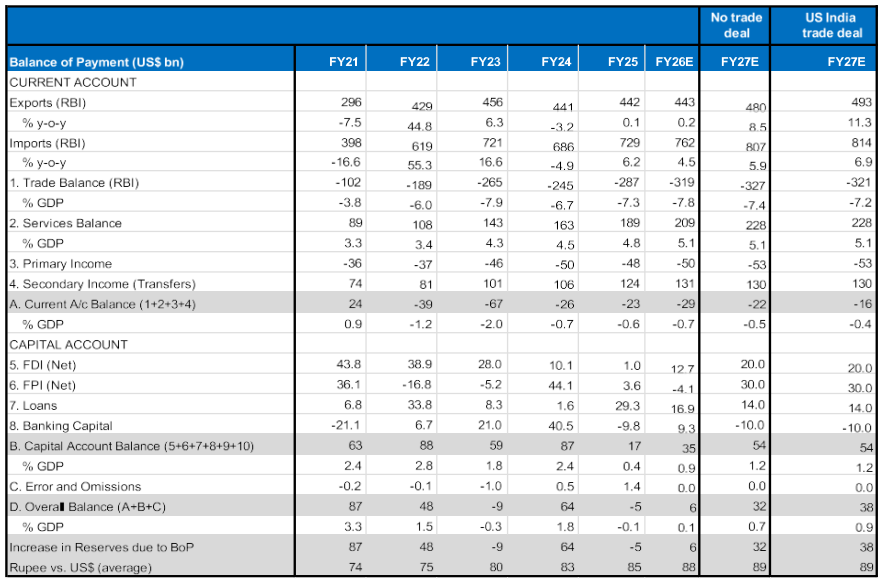 Source: RBI, SBIFM Research
Exhibit 65
Trade deal has had a significant impact on India’s
exports;
 Source: CMIE Economic Outlook, SBIFM
Research
Source: CMIE Economic Outlook, SBIFM
Research
Exhibit 66
Outlook for services exports stay healthy
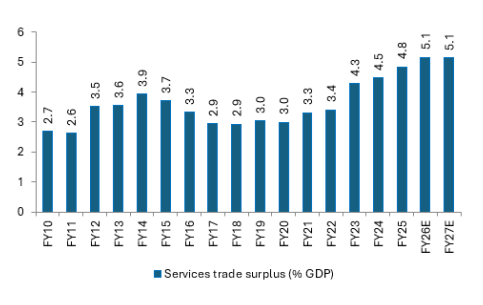
Exhibit 67
Gold prices rose sharply leading to gold import
volumes being subdued
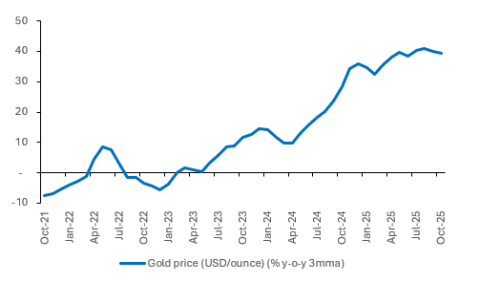 Source: CMIE Economic Outlook, SBIFM
Research
Source: CMIE Economic Outlook, SBIFM
Research
Exhibit 68
Outlook for services exports stay healthy
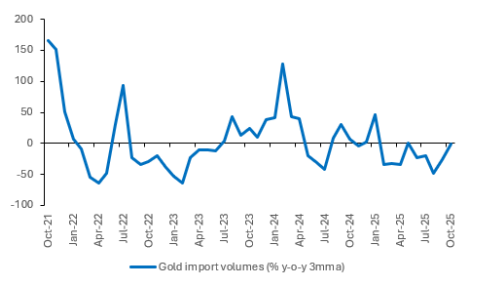
Exhibit 69
CAD to remain contained at under 1% of GDP for
FY26 and FY27
 Source: RBI, CMIE Economic Outlook, SBIFM
Research
Source: RBI, CMIE Economic Outlook, SBIFM
Research
Exhibit 70
INR REER is 5% below the fair value
 Source: CMIE, SBIFM Research


acfb44ed30d547d09bfedd904c194828)
0bf21f855da944d2a0c843c4553297d8)
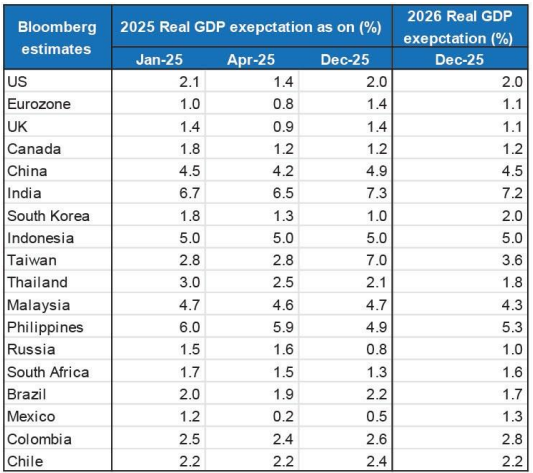 Source: Bloomberg, SBIFM Research; NB: Taiwan
and Philippines have seen material revision in their
2025 growth outlook; India data for FY26 is RBI’s
projection on financial year basis; FY27 is SBIFM
estimate
Source: Bloomberg, SBIFM Research; NB: Taiwan
and Philippines have seen material revision in their
2025 growth outlook; India data for FY26 is RBI’s
projection on financial year basis; FY27 is SBIFM
estimate
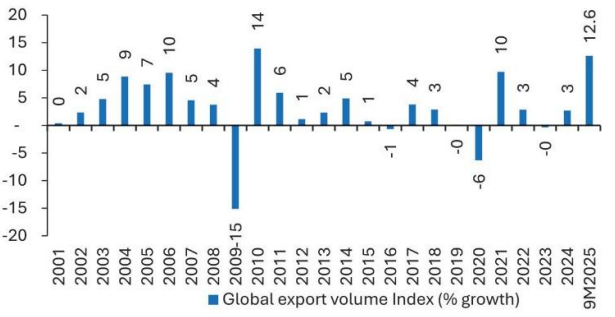 Source: Bloomberg, SBIFM Research
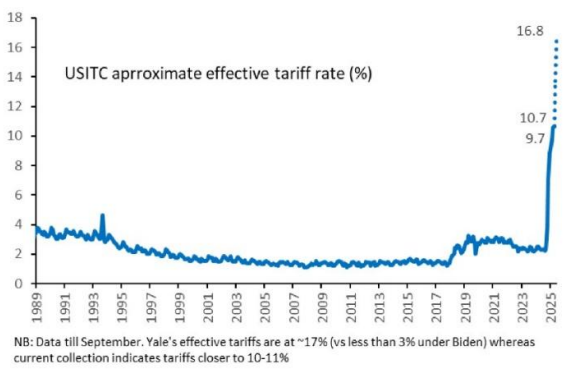 Source : Yale Budget Lab, Bloomberg, SBIFM
Research
Source : Yale Budget Lab, Bloomberg, SBIFM
Research
 Source: Bloomberg, SBIFM Research
 Source: Bloomberg, SBIFM Research
 Source Bloomberg, SBIFM Research, Forecasts
are Bloomberg estimates
Source Bloomberg, SBIFM Research, Forecasts
are Bloomberg estimates
 Source: Bloomberg, SBIFM Research; NB: Data
above reports y-o-y GDP instead of usually
referred to q-o-q SAAR
Source: Bloomberg, SBIFM Research; NB: Data
above reports y-o-y GDP instead of usually
referred to q-o-q SAAR
 Source: Bloomberg, SBIFM Research
 Source: Bloomberg, SBIFM Research
 Source: Bloomberg, SBIFM Research
 Source: Bloomberg, SBIFM Research
 Source: Bloomberg, SBIFM Research
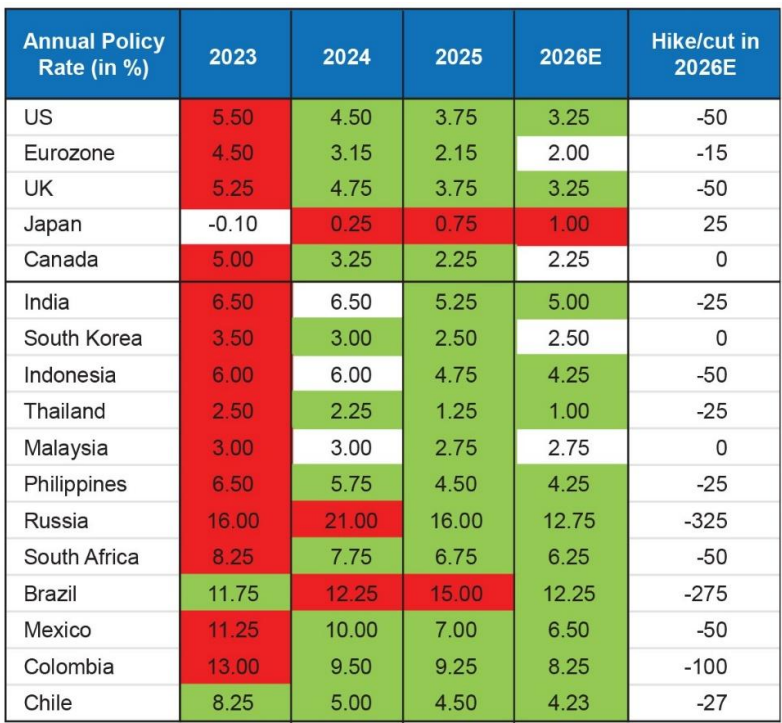 Source: Bloomberg, SBIFM Research; NB: Red
denotes rate hike and green denotes rate cut
Source: Bloomberg, SBIFM Research; NB: Red
denotes rate hike and green denotes rate cut


 Source: Bloomberg, SBIFM
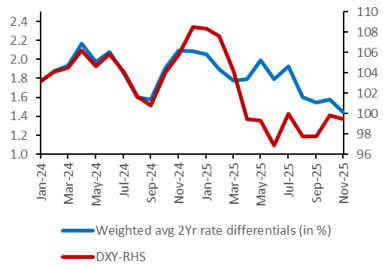 Source: Bloomberg, SBIFM Research; NB:
Interest rate differential is the US vs. the
economies that make up DXY index, German Bund is
taken as a proxy for Euro
Source: Bloomberg, SBIFM Research; NB:
Interest rate differential is the US vs. the
economies that make up DXY index, German Bund is
taken as a proxy for Euro
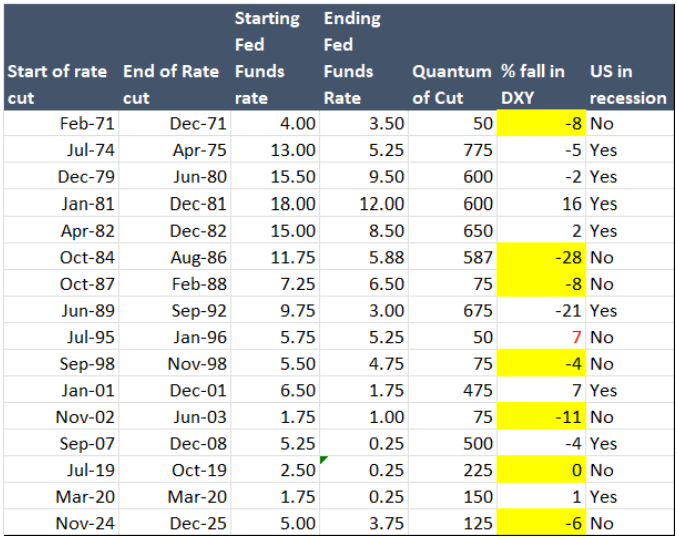 Source: Bloomberg, SBIFM Research; NB: Cells
highlighted depict depreciation in DXY when Fed cut
interest rates outside of the US recession
Source: Bloomberg, SBIFM Research; NB: Cells
highlighted depict depreciation in DXY when Fed cut
interest rates outside of the US recession
 Source: Bloomberg, SBIFM Research
 Source: Bloomberg, SBIFM Research
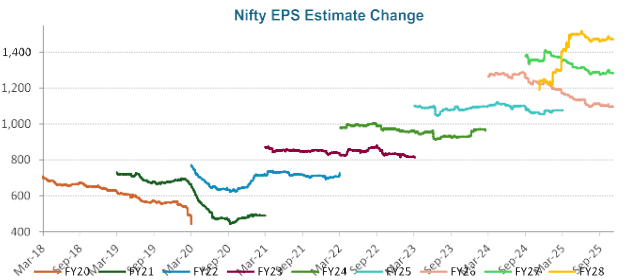
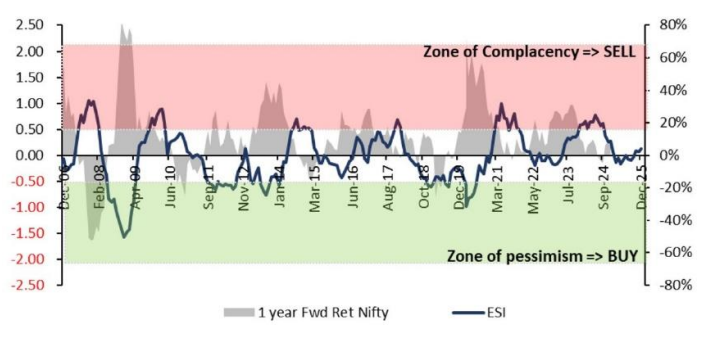 Source: Bloomberg, FactSet, SBIFM Research, ESI
stands for Equity Sentiment Index, our proprietary
equity sentiment measure
Source: Bloomberg, FactSet, SBIFM Research, ESI
stands for Equity Sentiment Index, our proprietary
equity sentiment measure
 Source: FactSet, SBIFM Research
 Source: Bloomberg, SBIFM Research
 Source: FactSet, SBIFM Research
 Source: Bloomberg, SBIFM Research
 Source: Bloomberg, SBIFM Research
 Source: Bloomberg, SBIFM Research
 Source: Bloomberg, SBIFM Research
 Source: FactSet, SBIFM Research
 Source: FactSet, SBIFM Research
 Source: FactSet, SBIFM Research
 Source: FactSet, SBIFM Research
 Source: FactSet, SBIFM Research

 Source: RBI, SBIFM Research
 Source: RBI, SBIFM Research
 Source: RBI, SBIFM Research
 Source: RBI, SBIFM Research
 Source: RBI, SBIFM Research
 Source: RBI, SBIFM Research
 Source: RBI, SBIFM Research

)
)