The return of an old problem
The inflation surge that began in 2022 has revived a debate many believed had been settled decades
ago. Central banks
initially characterised inflation as transient, shaped by temporary supply disruptions. Yet, as
price pressures proved more
persistent, the episode began to resemble earlier periods of sustained inflation. In particular, the
parallels with the 1970s have
become increasingly difficult to ignore.
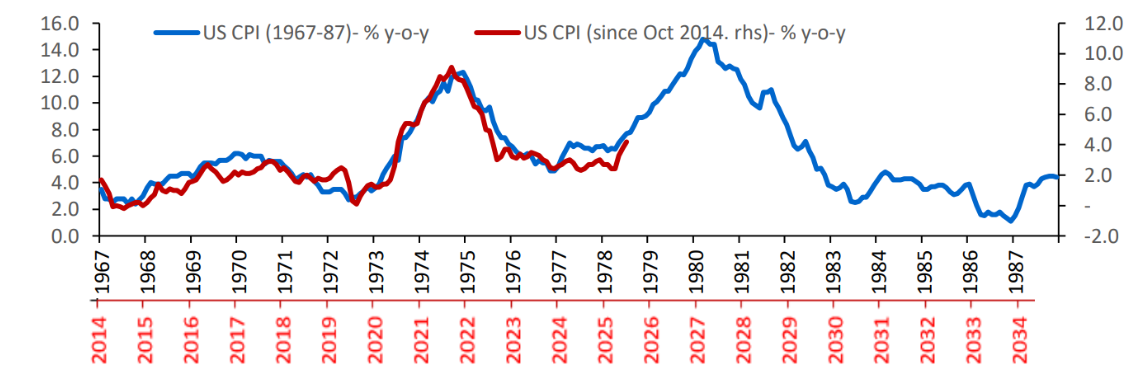
History suggests that inflation rarely arrives as a single, isolated shock. Instead, it tends to
emerge in waves. The 1970s
witnessed two distinct inflation episodes— the first in 1973–1974 and the second in 1979. (Exhibit
1). The possibility that
today’s cycle could follow a similar pattern—potentially culminating in a second wave later in the
decade—raises important
questions for policymakers and investors alike. If history repeats, investors must position
themselves in inflation-resilient assets
such as commodities, gold, and energy.
Exhibit 1: That 70s Show: Fears of a second wave of inflation
 Source :
St Louis Fred, Bloomberg, SBIFM Research
Source :
St Louis Fred, Bloomberg, SBIFM Research
At its core, inflation is not merely about rising prices. It is about the erosion of the value of
money. Periods of sustained inflation
are typically those in which monetary conditions cease to act as an anchor. When that anchor
weakens, price pressures can
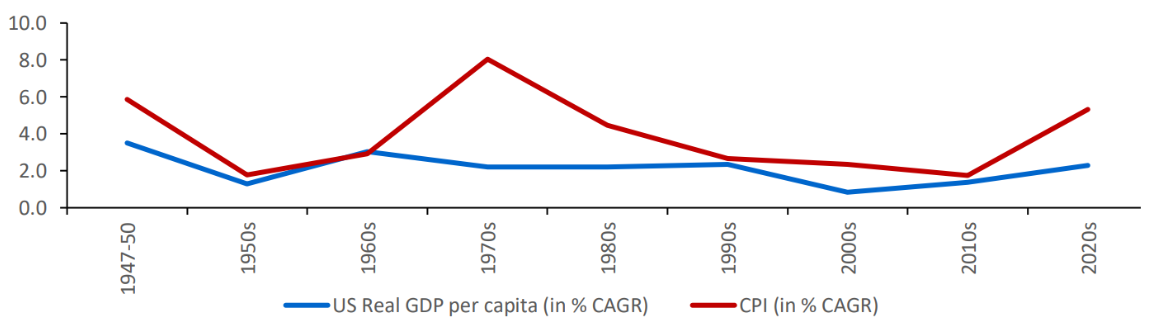
become entrenched, regardless of their initial source. Moderate inflation is considered necessary to
avoid deflation, which can
lead to excessive saving and economic stagnation. Historical data shows a positive correlation
between moderate inflation and
real GDP per capita growth, suggesting a healthy inflation range exists. However, rapid inflation
erodes purchasing power and
destabilizes economies (Exhibit 2). Central banks, therefore, aim to anchor inflation at moderate
levels, traditionally around 2%
in developed economies, though the optimal level remains debated.
Exhibit 2: Hyperinflation leads to erosion in purchasing power
 Source : Bloomberg, St. Louis Fred, SBIFM Research, Data till Q1 2026
Global inflation trends: Post-COVID divergence
Post-pandemic inflation was widespread and largely supply-driven,
exacerbated by US monetary policy. However, while many
economies returned to pre-COVID inflation levels, several developed markets—including the United
States, Japan, and much
of Europe—continue to experience elevated inflation. Emerging markets like Turkey, Argentina, and
Russia also show high
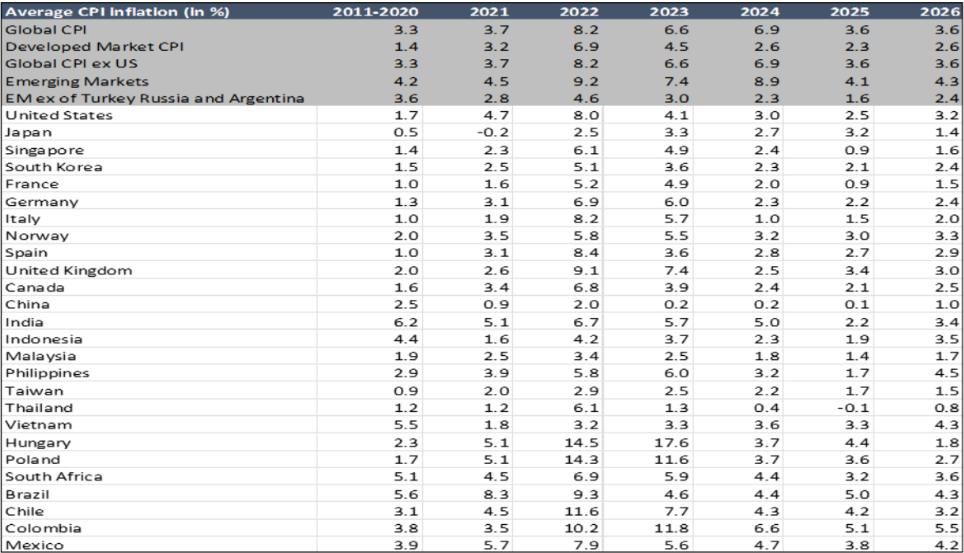
inflation, but these are attributed to country-specific factors. In contrast, inflation in emerging
market ex of these economies has
moderated from a historical average of 3.6% during 2011-2020 to 2.4%, while developed markets have
seen their inflation
average increase by about 1.2% pt from a pre-COVID baseline of 1.4% (Exhibit 3).
Exhibit 3: Inflation surge across developed markets while emerging
market inflation are relatively
contained
 Source : CEIC, SBIFM Research
A monetary lens on inflation
A long-term historical perspective reveals that episodes of persistent
inflation have been relatively uncommon. For extended
stretches of history, particularly under metallic monetary systems, the purchasing power of money
remained remarkably stable.
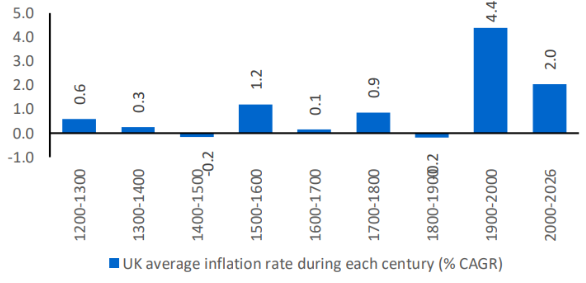
The major exceptions occurred when monetary anchors weakened or disappeared. The influx of precious
metals from the New
World into Europe during the sixteenth century triggered one such episode (Exhibit 4). A sudden
increase in the stock of silver
expanded purchasing power faster than available production, generating a broad rise in prices across
the continent.
The nineteenth century marked a contrasting experience. Many economies
increasingly tied their monetary systems to gold or
silver standards, effectively limiting the ability of governments and financial systems to expand
money supply at will. At the
same time, industrialisation and technological advances increased productive capacity. Since output
grew more rapidly than
the monetary base, prices often exhibited a tendency towards stability or even mild declines. In
this environment, money
preserved its value over long periods.
The twentieth century represented a profound break from this historical
pattern. The collapse of commodity-backed monetary
systems and the widespread adoption of fiat currencies transformed the relationship between money
and prices. Governments
and central banks gained greater flexibility to expand money supply in pursuit of economic and
political objectives. While this
flexibility supported economic growth and helped manage financial crises, it also contributed to
repeated inflationary episodes.
Over the century, the cumulative decline in the purchasing power of money was unprecedented compared
with earlier eras.
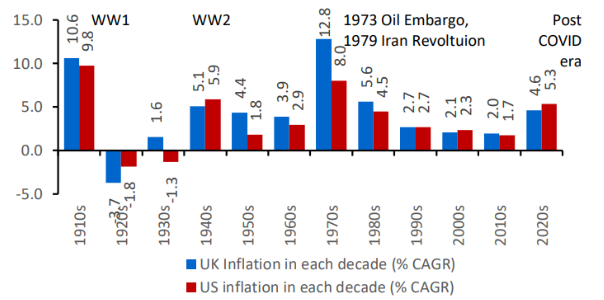
Importantly, inflation has rarely emerged solely because of isolated
price shocks. While events such as commodity shortages,
wars or energy crises often act as a catalysing force, historical evidence suggests these factors
become persistently inflationary
only when accommodated by loose monetary conditions (Exhibit 5 & 6).
Exhibit 4: Inflation through history – a long-term
perspective
 Source : Consumer Price Inflation in the United Kingdom (CPIIUKA) |
FRED | St.
Louis Fed
Source : Consumer Price Inflation in the United Kingdom (CPIIUKA) |
FRED | St.
Louis Fed
Exhibit 5: A closer look at 20th century inflation cycles
 Source: Consumer Price Inflation in the United Kingdom (CPIIUKA) | FRED
| St.
Louis Fed, Bloomberg, SBIFM Research
Source: Consumer Price Inflation in the United Kingdom (CPIIUKA) | FRED
| St.
Louis Fed, Bloomberg, SBIFM Research
A misread of the history: Inflation in 1970s
The recent inflation episode is often described as supply-driven, linked
to pandemic disruptions, geopolitical fragmentation, and
energy shocks. While these factors clearly played a role, history cautions against placing too much
emphasis on proximate
causes. The experience of the 1970s illustrates this clearly. Oil price shocks are widely viewed as
the trigger for inflation during
that period:
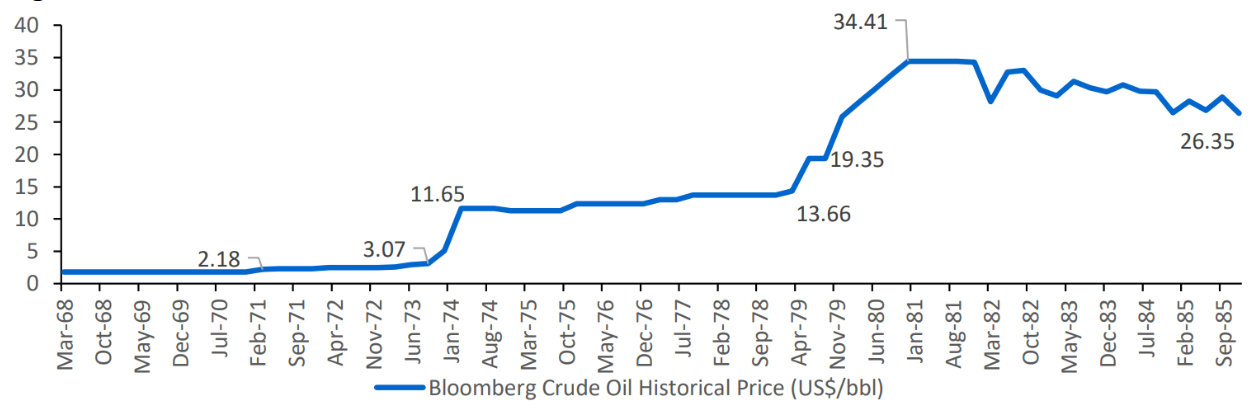
a) 1973 oil shock: Triggered by the Yom Kippur War and an oil embargo,
prices rose from ~$3 to ~$12 per barrel (Exhibit 7).
b) 1979 oil shock: Caused by the Iranian Revolution, prices jumped from
~$14 to ~$34 per barrel (Exhibit 7).
However, closer examination shows that inflation had already been rising
before oil prices surged. The oil shocks acted as
accelerants, not root causes.
What ultimately sustained inflation was an environment of excessively
loose monetary policy, strong demand, and rising wages.
In other words, inflation persisted not because of the shock itself, but because the underlying
monetary and economic conditions
allowed it to do so.
This distinction is crucial. Inflation can have many immediate
triggers—energy prices, supply bottlenecks, or fiscal stimulus—
but its persistence is typically a function of monetary conditions. As centuries of data suggest,
inflation is fundamentally a
monetary phenomenon.
Exhibit 7: A misreading of history: the 1973 and 1979 oil shocks were
accelerants, not the root cause of inflation
surge
 Source :
Bloomberg, SBIFM Research
Source :
Bloomberg, SBIFM Research
Real wage growth and policy focus on growth
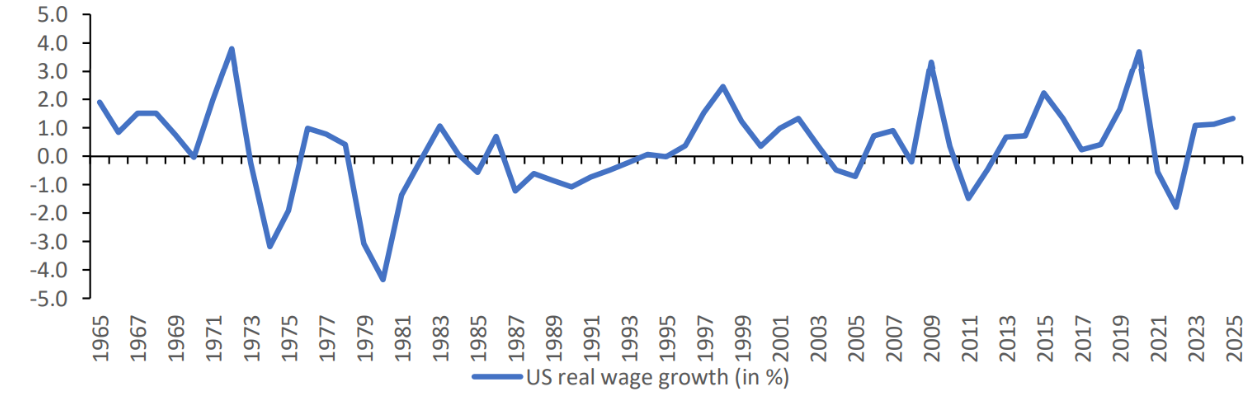
In the US, real wage growth from 1965 to 1971 averaged 1.5–2%, indicating strong labour demand
(Exhibit 8). This was driven
by Lyndon Johnson’s “Great Society” programs aimed at full employment and growth. Today, similar
growth-focused narratives-Trump’s “Make America Great Again” and Biden’s “Build Back Better”-
suggest a parallel emphasis on expansionary policies.
Exhibit 8: Real wage growth was consistently positive from 1965- 1972
 Source :Bloomberg, SBIFM Research
Inflation was already rising before the 1973 oil shock
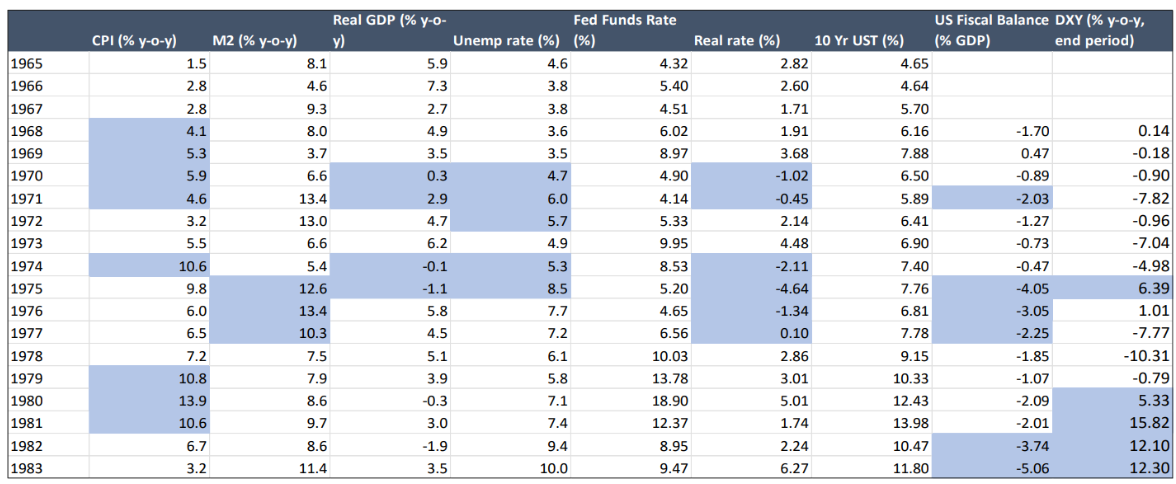
Crucially, US inflation had already risen from 2.8% in 1967 to 5–6% by
1970, before the oil shock (Exhibit 9). This early rise
signalled the emergence of stagflation—rising inflation alongside slowing growth. Growth collapsed
from ~5% in 1968 to near
zero in the 1970, undermining the traditional Phillips Curve relationship.
Policy misdiagnosis
One of the defining features of the 1970s was the misdiagnosis of
inflation by policymakers. At the centre stage of this, are the
economies like US and UK. Central banks in these two large economies viewed inflation largely as a
cost-push phenomenon,
driven by wages, commodity prices, or external shocks. This led to a misplaced reliance on
administrative measures such as
wage and price controls rather than appropriate monetary tightening.
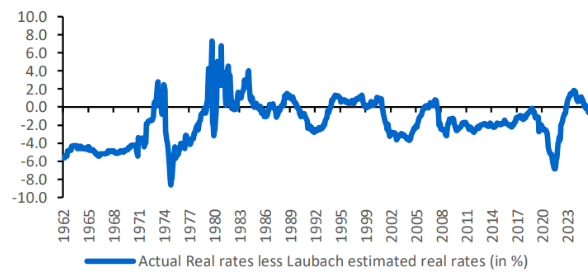
The consequences were severe. Real interest rates remained negative for
prolonged periods (Exhibit 9), allowing inflationary
pressures to build. At the same time, political pressures undermined central bank independence,
further delaying the required
policy response.
Milton Friedman’s view- “inflation is always and everywhere a monetary
phenomenon”- was ignored until the late 1970s.
Policymakers blamed bad weather, food shortages, unions, corporate greed, and OPEC, but not money
supply. A major error
was the misjudgement of the output gap. Policymakers believed the economy was operating below
capacity, justifying
expansionary policy. Later analysis showed this was wrong. Similarly, inflation expectations were
slow to adjust.
Finally, by 1979, importance of monetary actions was brought back to the
table. M2 growth slowed sharply in 1978 from its high
rates of 1976 and 1977; while policymakers in 1978 allowed nominal interest rates to rise by more
than the increase in the
current year’s inflation rate. The turnaround in monetary policy that produced the early 1980s
disinflation began in 1978. This
led to a recession but broke the back of inflation by 1982–1983 (Exhibit 9).
Exhibit 9: US macro indicators (1965–1983): US Fed did not respond
vigorously to the outbreak of inflation
 Source : Bloomberg, SBIFM Research; NB: Coloured cell highlights noticeable
datapoints
Source : Bloomberg, SBIFM Research; NB: Coloured cell highlights noticeable
datapoints
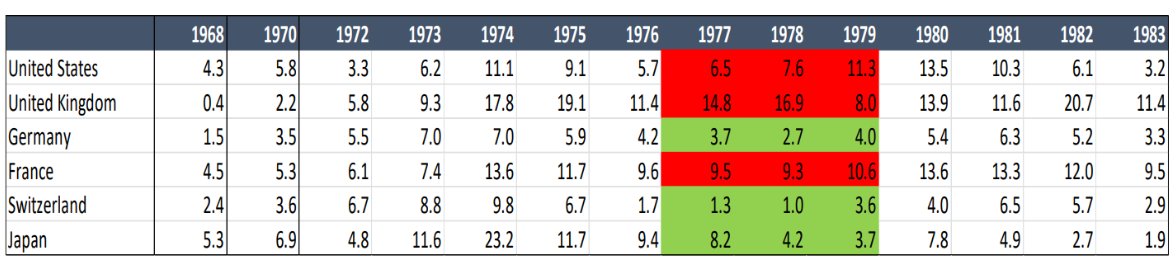
There were a few other economies such as Switzerland, Japan and Germany, where central bankers
responded much more
swiftly and were able to tame in inflation much more rapidly despite the 1979 Oil shock (Exhibit
10).
Exhibit 10: Policy credibility mattered across countries
 Source : World Bank, SBIFM Research
Box 1: What shaped inflation thinking in the 1970s?
The excerpts and quotations in this box are drawn from Edward Nelson's (2004) study, The Great
Inflation of the
Seventies: What Really Happened? Nelson compiled these statements from speeches, congressional
testimonies,
and contemporaneous newspaper archives to document how policymakers increasingly embraced
cost-push
explanations of inflation and relied on wage-price controls rather than monetary tightening
during the 1970s.
President Nixon, observing applause for Arthur Burns at Burns’ swearing-in (Feb-1970), said on
the record: “That
is a standing vote of approval, in advance, for lower interest rates and more money,” and noted,
“I have very strong views, and I expect to present them to Mr. Burns. I respect his
independence, but I hope that he independently
will conclude that my views are the right ones” (KCS, 02/01/70).
On December 4, 1969, Sylvia Porter, a financial journalist whose daily column was syndicated to
350 newspapers
in the U.S., claimed in a column entitled “Inflation: 1970- Style” that the U.S. was entering an
era of a new type of
inflation: “We are moving rapidly away from the type of inflation in which an excessive demand
for goods and
services pulls up prices (demand-pull) … We are swinging fast into an even worse type of
inflation in which
whopping wage increases will push up prices (cost-push). This type of wage-price spiral will
distort our economy
in 1970… This is the background for the emergence of the second type of inflation in our land.
(NYP, 12/04/69)”
Congressman Henry S. Reuss (D−WI) called for the President to organize a six-month price freeze
and an
agreement with labour on wages: “We should now have learned that tight money and tight fiscality
alone are not
enough” (MJ, 01/27/70).
In 1971, Chairman Burns switches to cost push view of inflation. The continuation of high
inflation beyond mid-1970 had convinced him that “the inflation we are still experiencing is no
longer due to excess demand…”.
“…monetary and fiscal tools are inadequate for dealing with sources of price inflation such as
are plaguing us
now—that is, pressures on costs arising from excessive wage increases” (December 7, 1970).
“… Despite much idle industrial capacity, commodity prices continue
to rise rapidly. And the experience of other
industrial countries, particularly Canada and the U.K., shouts warnings that even a long stretch
of high and rising
unemployment may not suffice to check the inflationary process”. (July 23, 1971, testimony, in
Burns, 1978).
1971−74: Chairman Burns would subsequently
characterize the Federal Reserve’s role in this expansionary phase
as feeling obliged to monetize the Federal government’s higher deficits, as: “the Federal
Reserve, among other
things, is the Government’s banker” (February 26, 1974, testimony, in Joint Economic Committee,
1974).
In January 1973, the six-month annualized CPI inflation rate rose to
4.4%, above the level prevailing when controls
were introduced. In August 1973, it stood at 9.5%. Chairman Burns blamed the initial rise on
“abuses of economic
power by both business firms and trade unions” (WP, 02/21/73); and in September 1973, he offered
a detailed
account of the upturn in inflation since January. There, he rejected arguments that expansionary
Fed policy in
1972 bore the blame for the rise in inflation, contending that the “severe rate of inflation
that we have experienced
in 1973 cannot responsibly be attributed to monetary management”
Money supply growth picked up again in 1975–76, well before inflation
rose in 1977. Policymakers continued to
attribute inflation to food, energy, wages and sectoral price shocks, not demand conditions.
Even falling
inflation in 1975 was explained by temporary easing in commodity prices rather than policy
restraint. Policymakers
believed output gap was deeply negative (double-digit), which validated the view that inflation
was not driven by
demand, and justified continued expansionary demand policies.
Carter administration pursued strong growth targets (e.g., ~6% real
growth). Anti-inflation measures focused on
price controls, wage guidelines, and sector interventions. Inflation control was delegated to
administrative tools,
not monetary tightening. Policymakers doubted that higher interest rates could materially
restrain demand. Wage�price guidelines were repeatedly tried (1977–78). Dollar depreciation
(1978) forced tighter monetary policy. Policy
tightening happened reluctantly and via exchange-rate concerns, not due to acceptance of
monetary causes of
inflation. Policy in 1975–78 combined expansionary demand, cost-push beliefs, and reliance on
controls, delaying
monetary tightening and setting up the late-1970s inflation resurgence.
Miller in 1978: He endorsed several aspects of the cost-push view of
inflation, suggesting that monetary policy
was becoming ineffective at restraining demand. “The public has built up some sort of antibodies
that resist the
impact of higher interest rates” (WP, 07/30/78). Although, in principle, this perspective might
mean pushing interest
rates up further than otherwise in fighting inflation, Miller said he expected interest rates to
peak soon and to begin declining in 1979, with no recession. (Source: Nelson, E. (2004), The
Great Inflation of the Seventies: What Really
Happened? Federal Reserve Bank of St. Louis Working Paper No. 2004-001)
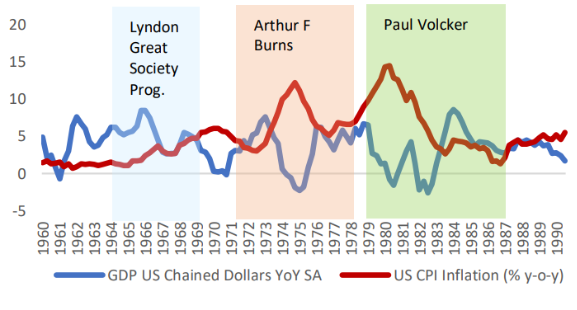
Exhibit 11: Three episodes of stagflation
 Source : Bloomberg, SBIFM
Research
Source : Bloomberg, SBIFM
Research
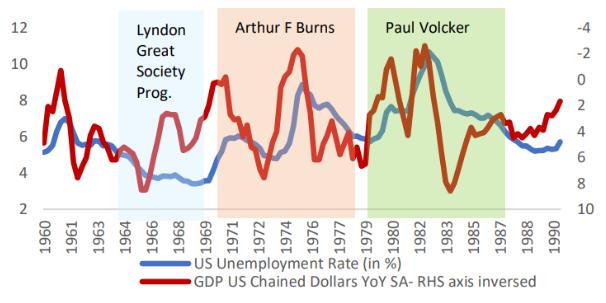
Exhibit 12: Unemployment rise in 1970s
 Source: Bloomberg, SBIFM Research
Exhibit 13: Real rates were kept much lower than
required
 Source : Bloomberg, SBIFM
Research
Source : Bloomberg, SBIFM
Research
Exhibit 14: Money supply was increased to combat the
external shocks
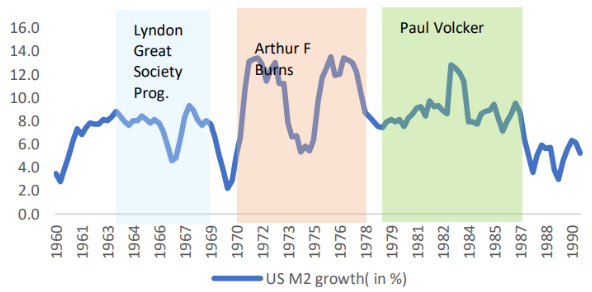 Source: Bloomberg, SBIFM Research
Exhibit 15: Dollar weakened throughout 1970s
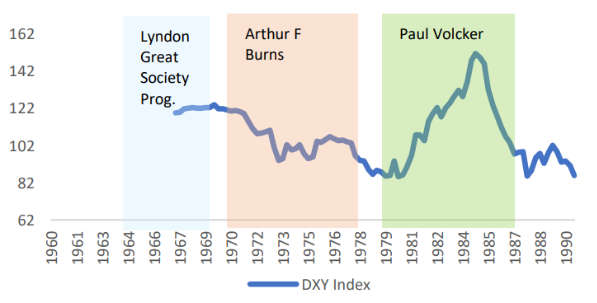 Source : Bloomberg, SBIFM
Research
Source : Bloomberg, SBIFM
Research
Exhibit 16: Fiscal wasn’t an issue
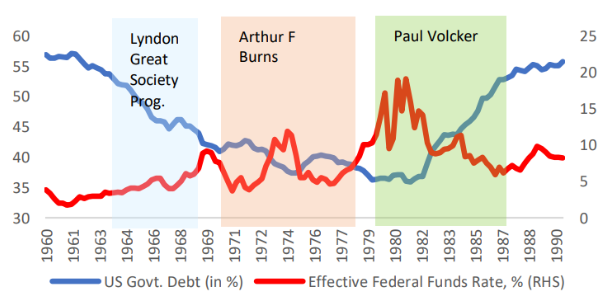 Source: Bloomberg, BIS, SBIFM Research
Inflation and the structure of the economy today
The recent cycle shows uncomfortable similarities. During the pandemic,
monetary policy was loosened
aggressively in
response to what was widely perceived as a demand shock. The shock had a significant supply-side
component. Loosening
financial conditions in such an environment increases the likelihood that rising demand will
translate into higher prices rather
than higher output.
Moreover, central banks placed significant weight on inflation expectations, if as long as
expectations remained anchored,
inflation would remain contained. History suggests otherwise. Expectations tend to adjust slowly and
may only respond after
inflation has already become entrenched.
Despite these parallels, today’s environment is not identical to the
1970s. Over the past four decades, several structural forces
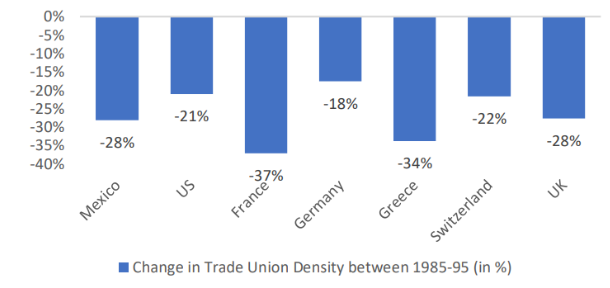
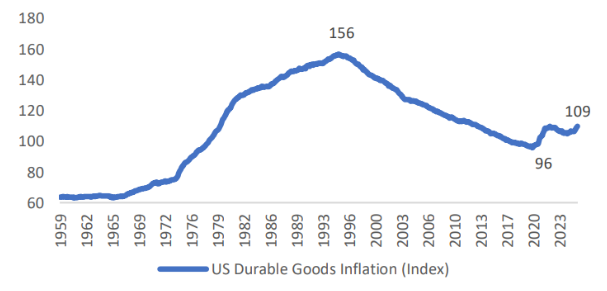
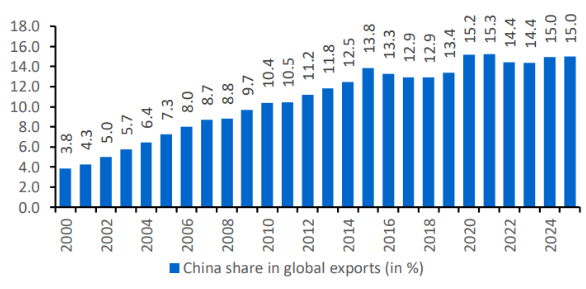
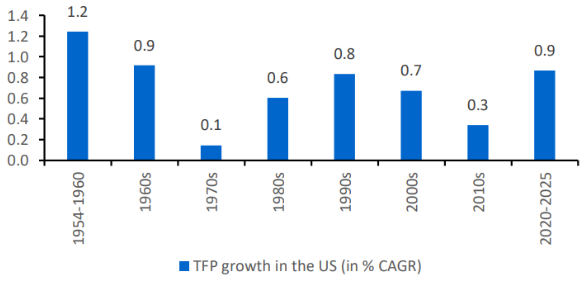
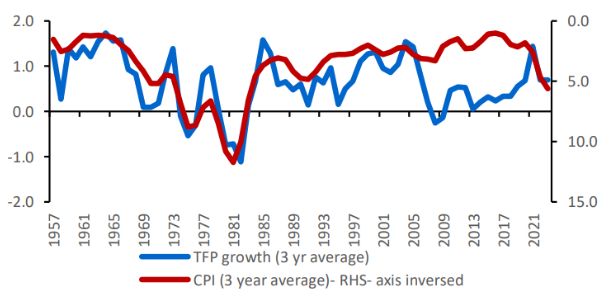
have acted to suppress inflation. These include weaker labour unions, increased globalisation,
technological innovation, and
improved productivity (Exhibit 17-22).
Exhibit 17: Labour rigidities amplified inflation in 1970s
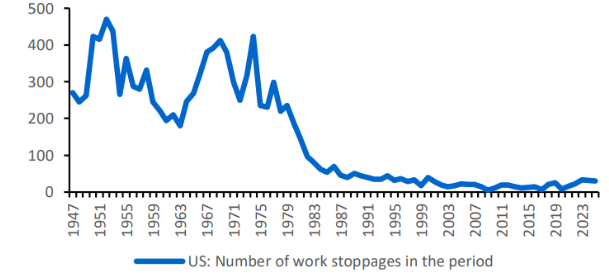 Source :ILO, https://www.bls.gov/web/wkstp/annual-listing.htm, SBFIM
Research
Source :ILO, https://www.bls.gov/web/wkstp/annual-listing.htm, SBFIM
Research
Exhibit 18: Industrial relations were weak in 1960-70s
 Source: ILO, SBIFM Research
Exhibit 19: Structural disinflation in the modern era
owing to better technology
 Source :Bloomberg, SBIFM Research
Exhibit 20: China’s role in global prices
 Source: Bloomberg, CEIC, SBIFM Research
Exhibit 21: 1970s saw a significant fall in productivity.
It’s improving in the current decade
 Source : St Louis Fred, US Bureau of labour statistics, SBIFM Research
Exhibit 22: Higher productivity growth leads to
contained inflation
 Source: Bloomberg, St Louis Fred, US Bureau of labour statistics, SBIFM
Research
Source: Bloomberg, St Louis Fred, US Bureau of labour statistics, SBIFM
Research
These forces helped anchor inflation during the period from the 1990s through to the pandemic.
However, some of them are
now weakening or reversing. Globalisation is giving way to geopolitical fragmentation, labour
markets are tightening, and fiscal
policy has become significantly more expansionary.
At the same time, monetary expansion during the pandemic reached unprecedented levels. While
inflation did not rise
immediately—due in part to lockdown-induced reductions in velocity—the underlying monetary impulse
remained. Once
demand normalised, the interaction between strong spending and constrained supply led to a sharp
increase in prices.
This interaction highlights a key point: inflation is not determined solely by supply or demand
conditions. It is the combination
of both, mediated through monetary policy, that ultimately determines outcomes
In practice, this structure enforces discipline but
reduces flexibility during volatile periods. Liquid funds,
for example, cannot invest beyond 91 days, while overnight
funds are restricted to one-day instruments such as TREPS.
Furthermore, equity and hybrid funds often maintain cash
balances for margin requirements related to futures
positions, and these balances cannot be freely deployed
into longer-dated CP or CD instruments.
As a result, headline liquidity metrics-such as large
volumes in the collateralized TREPS market—overstate the
amount of AUM available for CD and CP deployment (Exhibit
7). Only a subset of debt funds has both the mandate and
the risk appetite to meaningfully invest beyond overnight
instruments.
The role of credibility and expectations
The experience of the 1970s also underscores the importance of policy credibility. Once inflation
becomes entrenched, it is
extremely difficult to reverse without significant economic costs.
The turning point came with the appointment of Paul Volcker as Federal Reserve Chair in 1979. By
sharply raising interest
rates and restoring positive real rates, the Fed was able to break the back of inflation—albeit at
the cost of a deep recession.
This episode reinforced a key lesson: controlling inflation requires
decisive and credible policy action. Delayed responses only
increase the eventual cost of stabilisation.
Today, central banks have responded more quickly than in the 1970s.
Monetary policy errors were rectified rapidly from 2022
onwards. Rates have turned restrictive, and money supply growth has slowed materially. This suggests
that, in the base case,
inflation may be contained without a repeat of the extreme volatility seen in the past.
Financial repression as the key macroeconomic risk
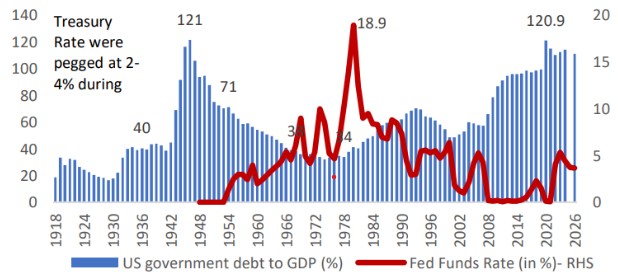
The principal risk facing the global economy today is not a resurgence of traditional inflationary
pressures, but the possibility of
financial repression. Rising public debt burdens have materially increased fiscal vulnerabilities
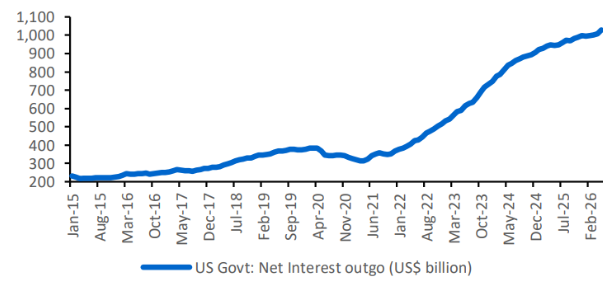
(Exhibit 23), with US net interest
payments expanding from approximately $300-400 billion in 2020 to over $1trillion (Exhibit 24). This
raise concerns that fiscal
dominance could eventually constrain monetary policy, creating incentives to tolerate moderately
higher inflation as a
mechanism to reduce the real value of government debt. The Silicon Valley Bank episode demonstrated
how quickly policy
priorities can shift when financial stability concerns emerge. Although monetary policy currently
remains restrictive, with money
supply growth broadly aligned with nominal GDP growth of around 4.5%, debt sustainability pressures
continue to pose a latent
risk of policy error.
Exhibit 23: Risk of financial repression
 Source :
https://www.federalreservehistory.org/essays/feds-role-during-wwii, BIS,
SBIFM Research
Source :
https://www.federalreservehistory.org/essays/feds-role-during-wwii, BIS,
SBIFM Research
Exhibit 24: Rising interest burden for US Treasury
 Source: Bloomberg, SBIFM Research
A base case and a warning
The current environment is best understood as a transition from a low-inflation regime to one
characterised by greater
uncertainty. Structural disinflationary forces have somewhat weakened, while new risks—geopolitical
fragmentation, fiscal
expansion, and debt sustainability concerns—have emerged (Exhibit 25).
The base case remains that inflation can be contained, supported by tighter monetary policy and a
re-anchoring of expectations.
However, the primary risk lies in a gradual shift towards financial repression, where policymakers
prioritise debt management
and economic growth over price stability. Such an outcome would be more likely to produce
intermittent and volatile inflation
cycles rather than a sustained inflationary surge. In this context, real policy rates relative to
the neutral rate remain a critical
indicator of future inflation dynamics.
Exhibit 25: Then vs now – what has changed?
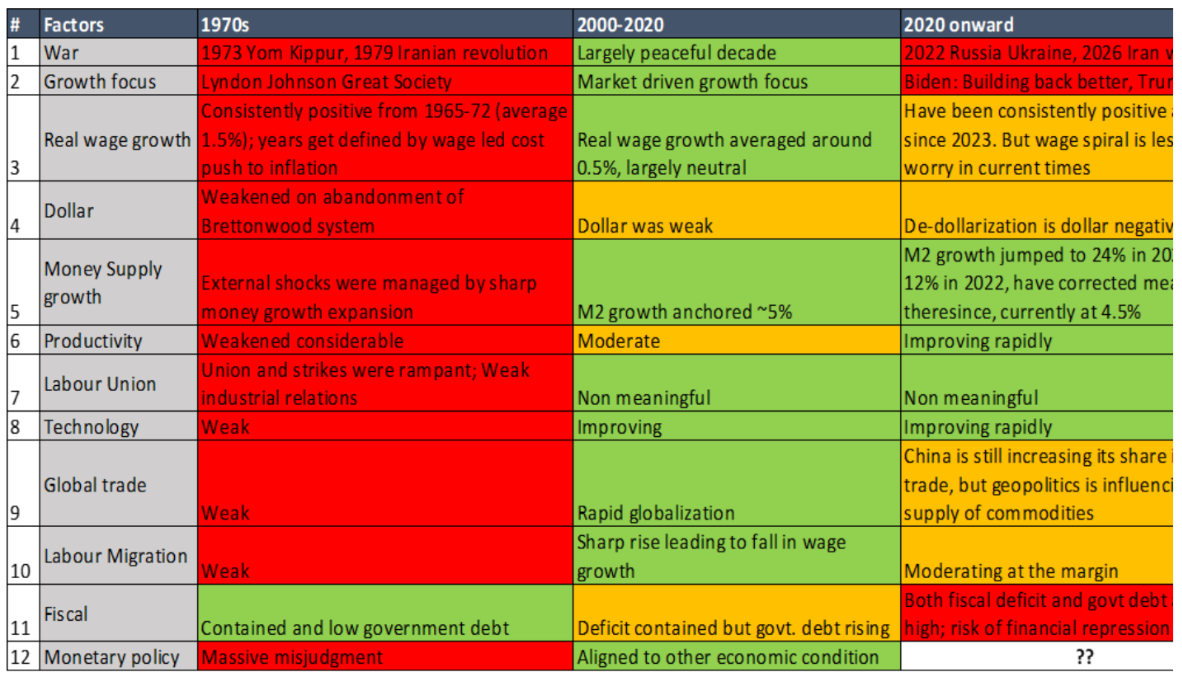 Source : SBIFM Research; NB: Red highlights materially adverse for inflation
outlook, amber suggest moderate inflationary pressures, green is favourable
for keeping inflation in check
Source : SBIFM Research; NB: Red highlights materially adverse for inflation
outlook, amber suggest moderate inflationary pressures, green is favourable
for keeping inflation in check
Investment implications
A regime characterised by recurring inflationary pressures would favour
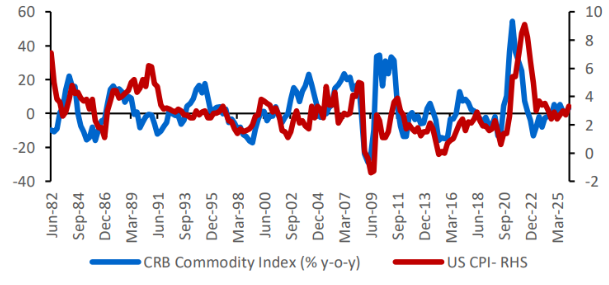
real assets such as commodities, energy, and gold,
which historically outperform during periods of inflation and supply shocks (Exhibit 26).
Conversely, long-duration fixed income
assets remain vulnerable to inflation surprises and expansionary fiscal policies (Exhibit 27). The
investment environment is
therefore likely to reward active asset allocation and tactical positioning rather than reliance on
traditional long-term safe
havens.
Exhibit 26: Commodities performance
 Source :
Bloomberg, SBIFM Research
Source :
Bloomberg, SBIFM Research
Exhibit 27: Bond and Inflation
Source: Bloomberg, SBIFM Research
Conclusion: not a repeat, but a reminder
History does not repeat itself in precise detail. The institutional frameworks, structural
conditions, and policy tools of today differ
significantly from those of the 1970s. Yet the underlying lessons remain strikingly relevant.
Inflation is rarely the result of a single shock. It reflects broader monetary and policy dynamics.
Misdiagnosis, delayed
responses, and political interference can allow it to persist and intensify. Conversely, credible
and disciplined policy can restore
stability—but often at a cost.
The current episode should therefore be seen not as a replay of the past,
but as a reminder of the risks that arise when the
monetary anchor weakens. As long as central banks remain committed to maintaining that anchor, a
sustained inflation breakout
may be avoided. But the margin for error is thin, and vigilance remains essential.
Provided central banks maintain a credible commitment to price stability, a repeat of the
inflationary experience of the
late 1970s can likely be avoided. Nevertheless, policy misjudgement remains the single most
significant risk to the
inflation outlook.










)
)
0bf21f855da944d2a0c843c4553297d8)