Price of reigning in inflation is a recession, which seems
to be the only way out today. But the question is by when,
and how deep? And how to think about financial market
outcomes in such times.
6 coincident activity measures used by the NBER’s Business
Cycle Committee to declare recession in the US points to a
likely recession in the US by 3Q 2023 or latest by 4Q.
Leading indicators point to a significant downturn in the US
manufacturing and residential investment sector resulting in
a fall in US imports and new orders. US job market is
holding strong for now despite multiple anecdotes of
layoffs.
During inflationary periods, it's not unusual for employment
downturns to begin months, after the start of recession. We
saw that in 1973-75 and 1980 recession. Higher inflation
leads to a delayed onset of profitability loss, which in
turn delays the layoffs. Presently, corporate profit will
act as a leading indicator of wage growth and inflation
moderation.
1973 and 1980 recession saw rate hikes owing to higher
inflation and strength in job market data. Given that
inflation, corporate profits and job market data rhymes
closer to the decades of 1970s-80s, market has been
consistently trumped in pre-empting rate cuts.
Synchronized and aggressive rate hikes thus far make a case
for deeper problems in real economy ahead. The aggressive
rate hikes of 1980s to single-mindedly tame down inflation
was also made possible due to contained leverage in the
system. Things are quite different today with government
debt to GDP ~110% (vs. ~35% during 1980s). Consequently,
even as the US Fed wants to retain its inflation fighting
credibility, the issue of financial stability (emanating
from high leverage) will make it harder going ahead.
Aggressive tightening thus far and concerns on financial
stability implies slower growth going ahead and then key is
to figure out how does market behave during growth
corrections. Equity market starts to correct prior to
recession onset but bottoms out even as we are into the
recession. During 1973, 2001 and 2008 recession, S&P fell by
~50%. On other occasions, there has been ~20% corrections
(1981, 1990 and 2020 recession). Currently, S&P has fallen
17% from its peak.
The template for fixed income assets were very different
during 1970s-80s, compared to last three decades when
duration assets start to perform at mature stage of rate
cycle.
2022 was one of the worst years for combined returns of
stocks and bonds market in the US. In 2023, equity market
prospects is still grim unless we see a significant dovish
tilt by the US Fed and greater clarity on depth and breadth
of recession. Outlook for duration assets is improving at
the margin. That said, longevity of duration rally can be
challenged unless inflation is brought under complete
control.
Almost since the start of Fed tightening in the first
quarter of 2022, the most frequently asked question about
the global economy has been whether the FOMC’s fight to tame
inflation inevitably means the US economy is heading for
recession. Price of reigning in inflation is a recession,
which seems to be the only way out today. But the question
is by when, and how deep? And how to think about financial
market outcomes in such times.
Dating committee referred data hints at US recession by end
2023.
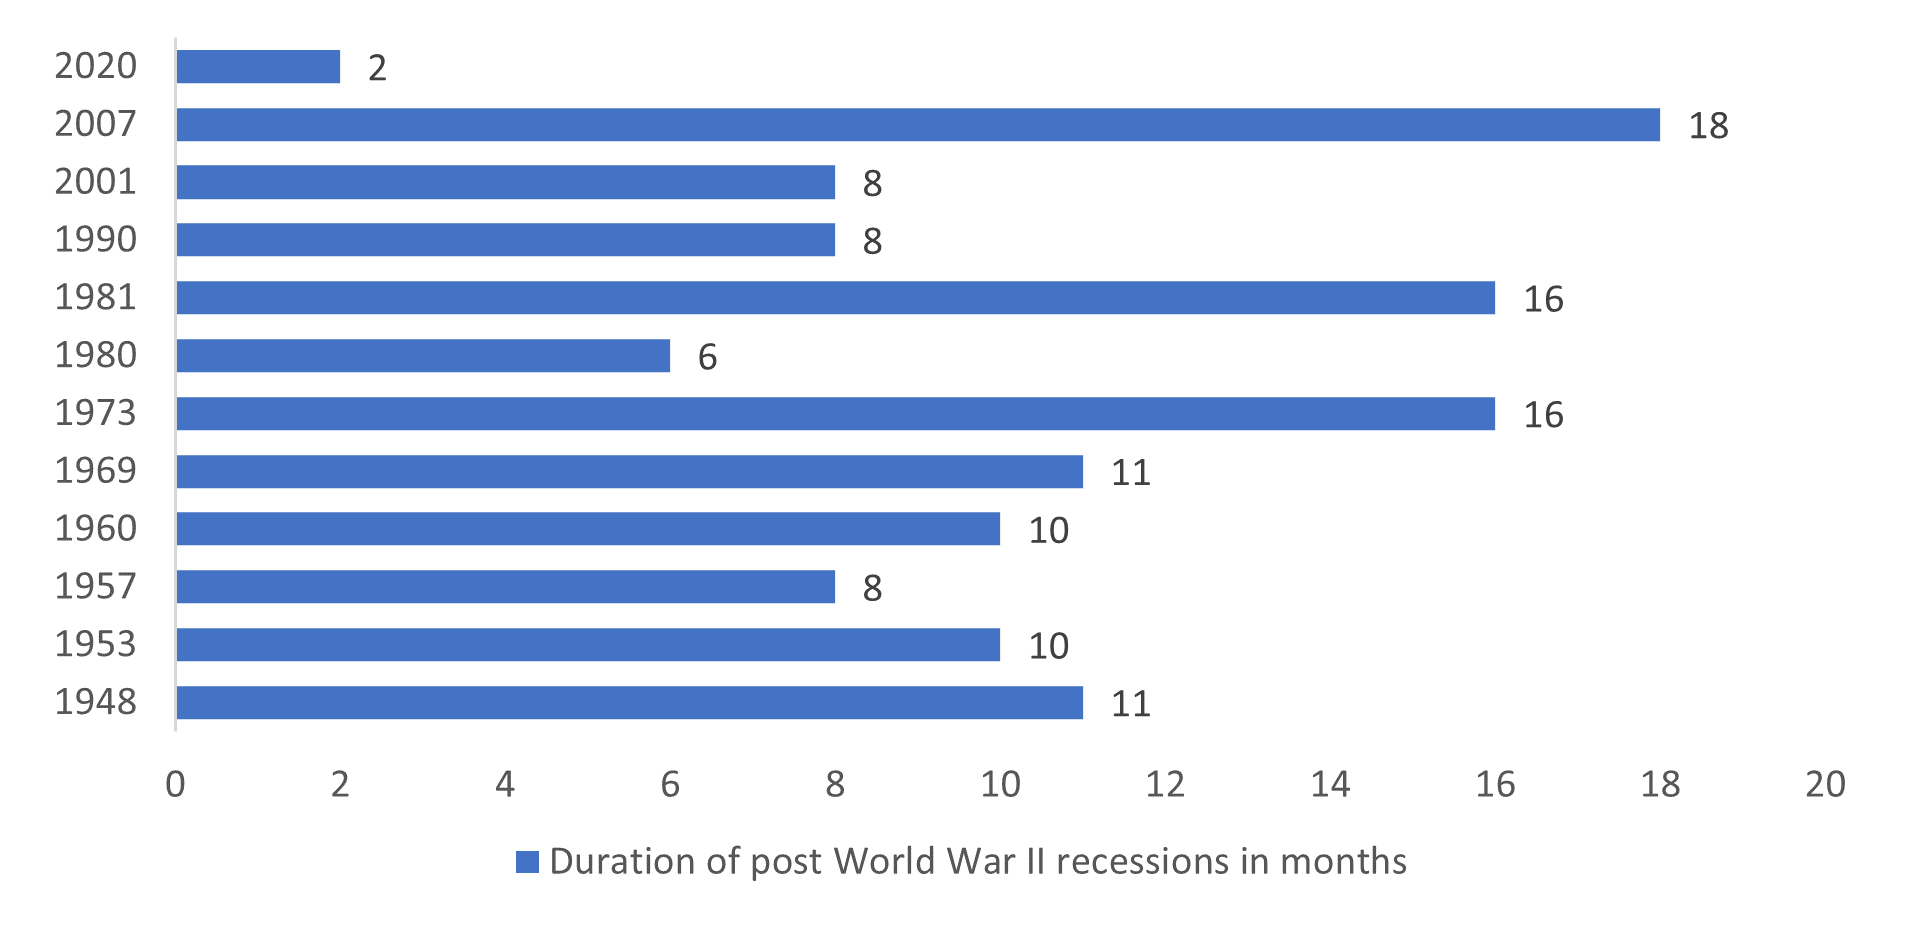
The US has seen 12 recessions post World War with 2008 GFC
being the longest and 2020 COVID being the shortest (Chart
1). The country has a separate organization, National Bureau
of Economic Research (NBER) which declares recession and it
may not necessarily coincide with the technical definition
of recession. NBER determines recession based on six
coincident monthly indicators listed below.
-
FRED real personal income less transfers
-
FRED nonfarm payrolls
-
FRED real personal consumption expenditures
-
FRED real manufacturing and trade sales
-
FRED household employment
-
FRED index of industrial production
Chart 1: US has seen 12 recessions since World War II,
typically lasting around three quarters
 Source: NBER, SBIMF Research
We looked at a simple average of %3m/3m annualized growth
rate for these six indicators. At an aggregate, it points to
a marginal expansion (0.4% 3m/3m ann. in Jan’23).
Historically, US has been declared into recession when the
aggregate of these activity indicators dips into
contraction. As of Jan’23, industrial activity shows
sharpest decline (-4.6% 3m/3m ann.), manufacturing and trade
sales are weak (0 on 3m/3m ann.). While on the other hand,
real income and non-farm payroll still holds up (2.1% and
2.5% respectively). Trend in these indicators point to a
likely recession in the US by 3Q 2023 or latest by 4Q.
Further, it is not necessary for all indicators to be in
negative for NBER to call out a recession in the US (1960,
1973, 1981 being a case in point).
A typical US recession starts with roll down in business
activity followed by job market slowdown
Industrial production and business sales are typically the
first one to start weakening in any recession followed by
employment (NFP and household employment). Household income
and employment roll over few months later, but may not
necessarily weaken as much (case of 1981, 2001). In 2001 –
in what was the mildest US recession ever (real GDP barely
declined) – employment fell in the first month of the
recession, because of a drop in manufacturing jobs amidst an
industrial recession. At the other extreme, during the most
severe post-war recession (until COVID) in 2008, all the key
components started to contract in Q1 2008, with consumption
lagging by just a couple of months.
Chart 2: US dips to recession when the aggregate of these
activity indicators posts negative print
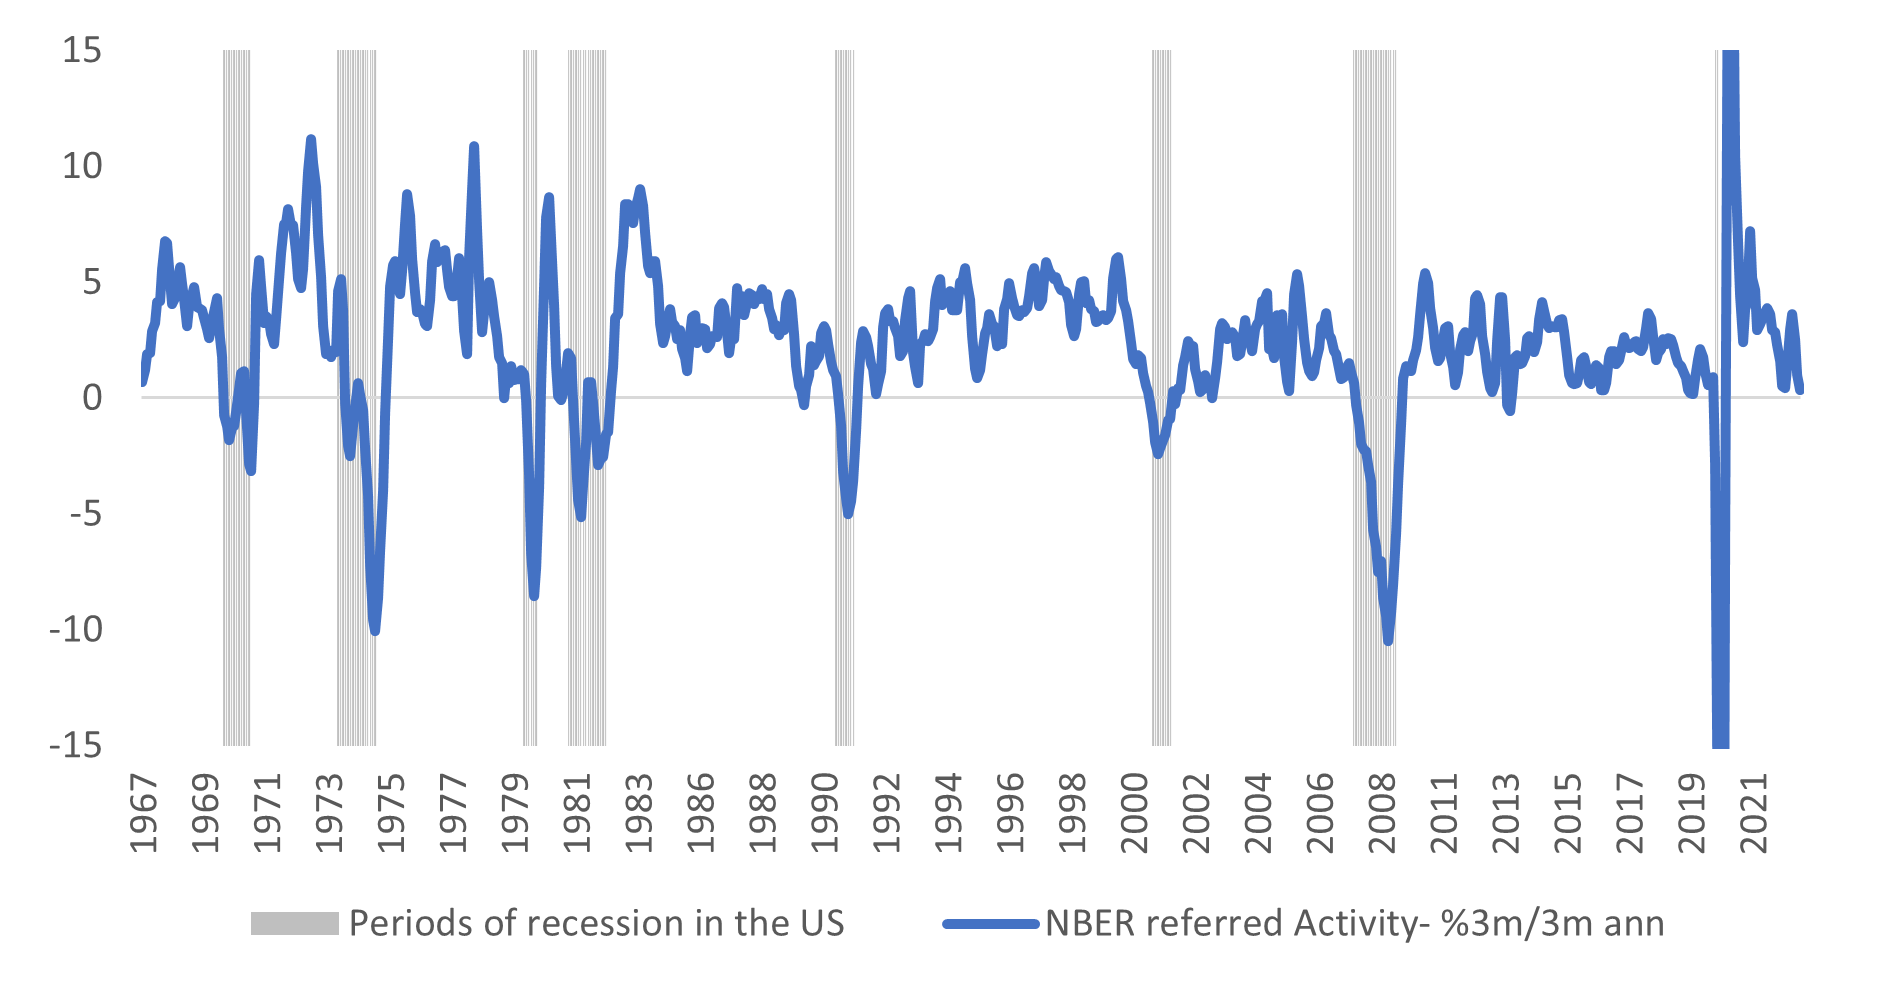 Source: FRED, SBIMF Research; NB: Simple average of %
3m/3m ann of 6 coincident activity measures used by the
NBER’s Business Cycle Committee
Source: FRED, SBIMF Research; NB: Simple average of %
3m/3m ann of 6 coincident activity measures used by the
NBER’s Business Cycle Committee
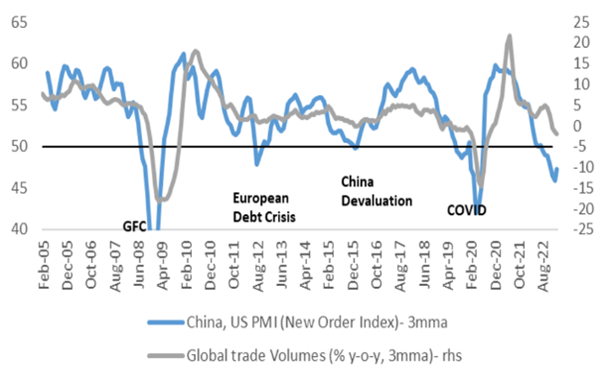
US is already amidst industrial recession with rapid
moderation in global trade
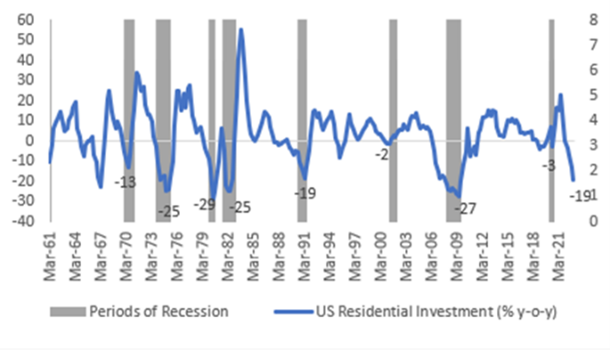
For the past year, the US has been undergoing what might be
described as step-by-step suppression of demand. Leading
indicators are pointing to a downturn in the US
manufacturing and construction (residential investment)
sector resulting in a fall in US imports and new orders. The
latest leg of the evolving slowdown is the one that the rest
of the world is feeling- i.e. the demand impact of receding
US imports.
But, with employment growth still strong, it is quite unlike
the recessions of recent decades.
Chart 3: US ISM New Order in contraction since Sep’22
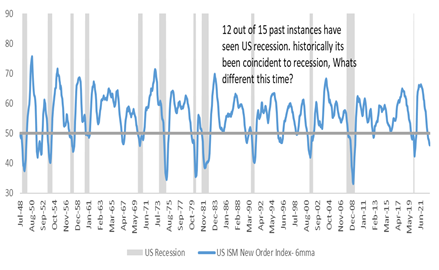
Chart 4: Global order inflows and trade volumes fall
 Source: Bloomberg, SBIMF Research
Chart 5: US real import growth contracts
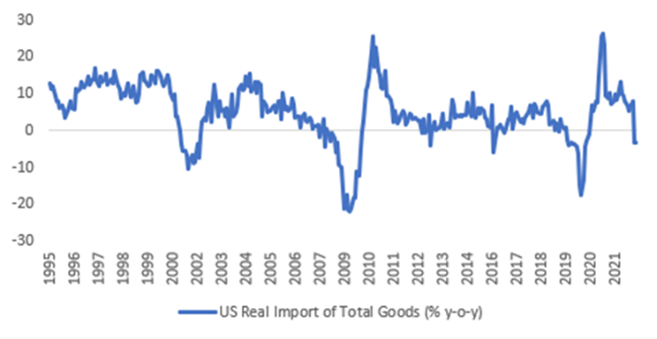
Chart 6: US Residential investment deeply negative
 Source: Bloomberg, SBIMF Research
Strength in the US job market is the biggest issue today.
Even as there are anecdotes of layoff, non-farm Payroll has
been exceptionally strong. Unemployment rate at 3.4% is at
record low. There are 1.9 jobs in the market today for every
one person looking for job which keeps the wage growth
elevated and inflation stickier than expected.
Illusion of Money: track corporate profits to understand job
market
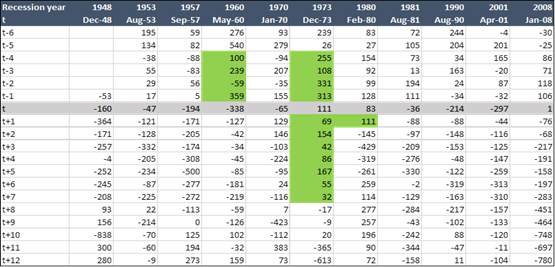
Typically, on most occasions of past recessions, the
incremental hiring activity at least starts to flatten
out/contract five to six months prior to recession. During
2008 GFC, negativity in jobs led the GDP growth negativity
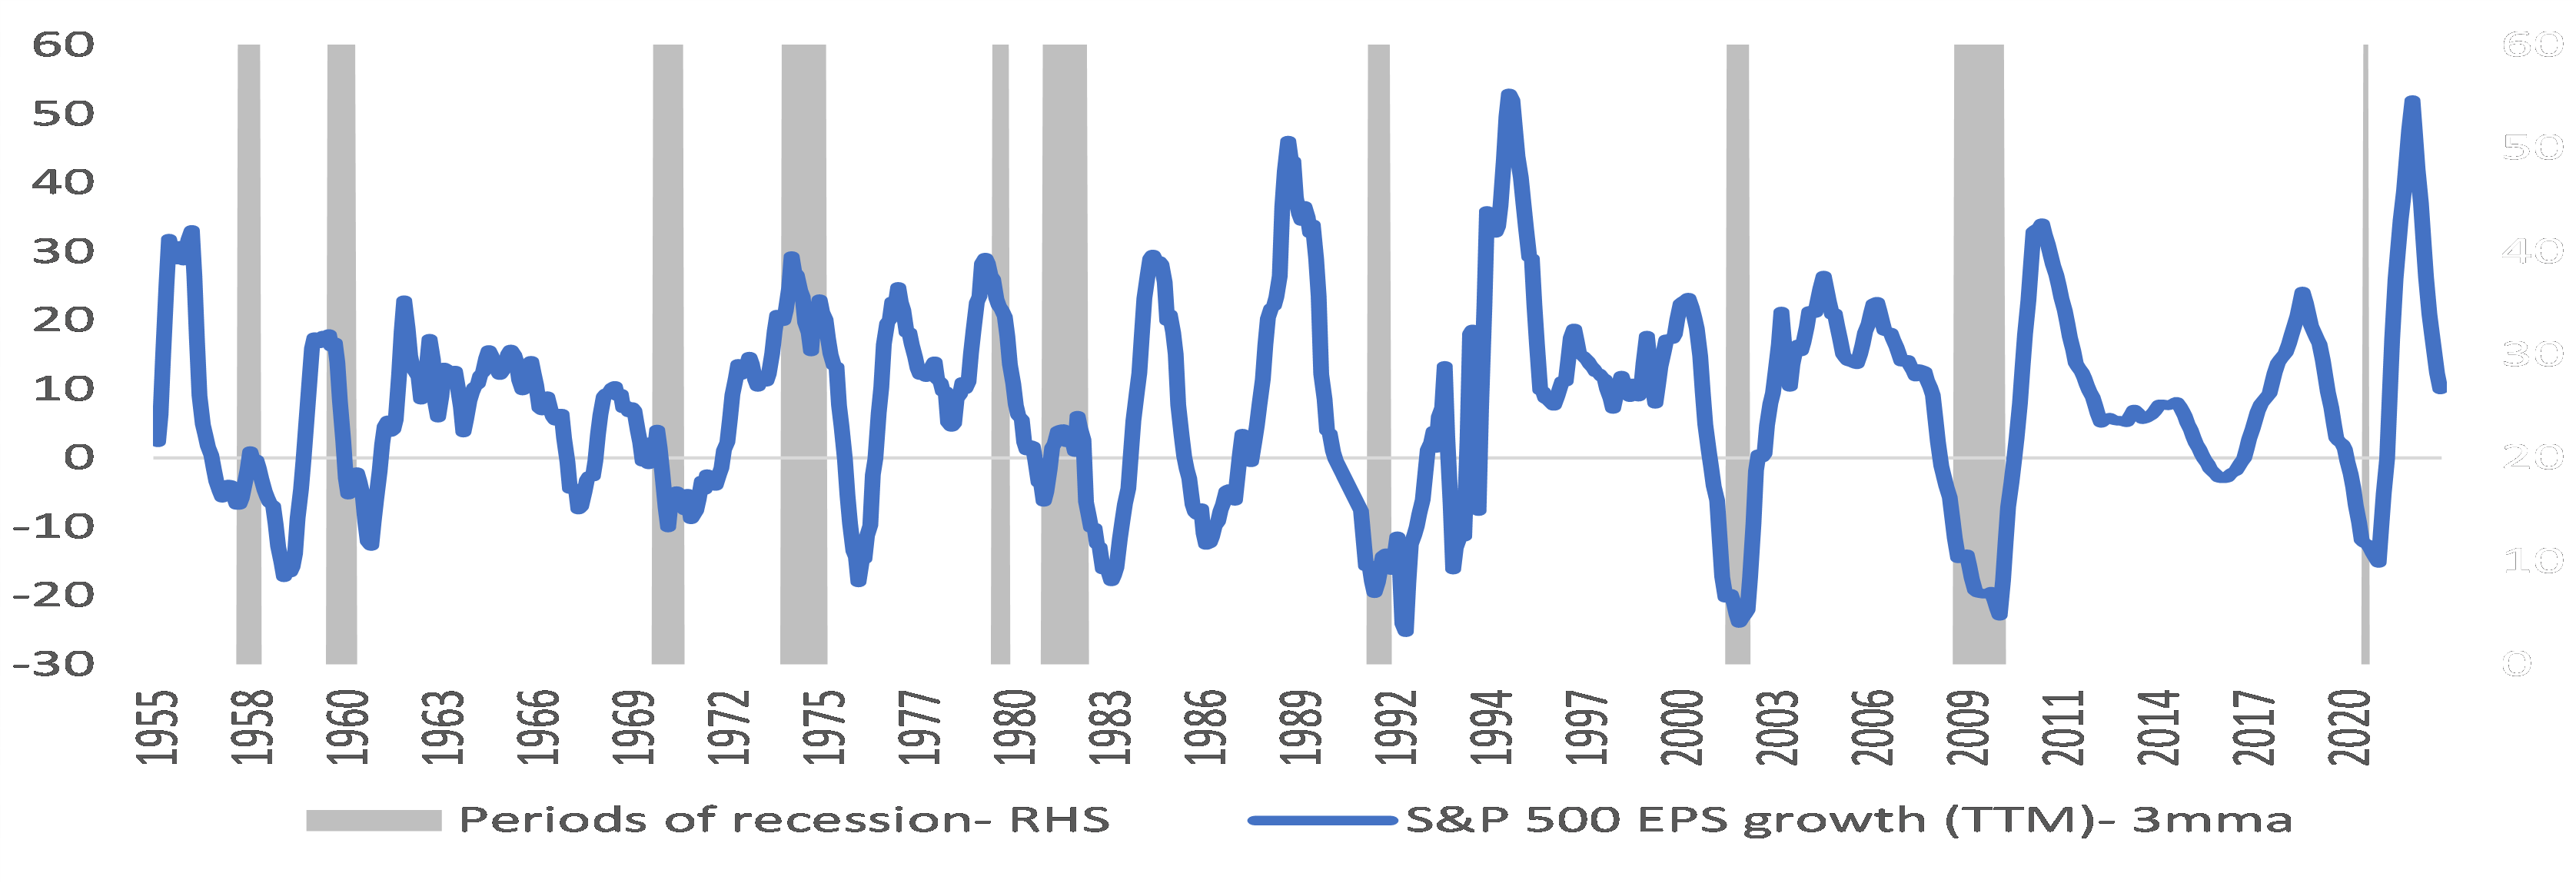
by 6 months. But during inflationary periods, it's not
unusual for employment downturns to begin months, after the
start of recession, i.e. we can be inside a recession and
still have jobs growth. We saw that in 1973-75 and 1980
recession. This can be best described as illusion of money
during inflationary times. Higher inflation leads to a
delayed onset of profitability loss, which in turn delays
the layoffs. Thus, in today’s time too, corporate profit
will act as a leading indicator of job loss.
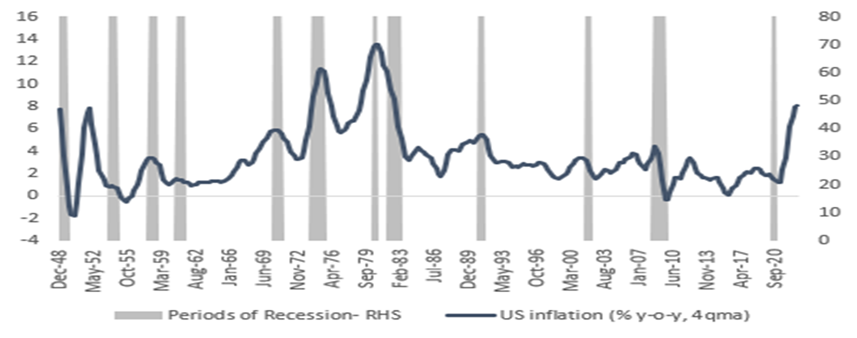
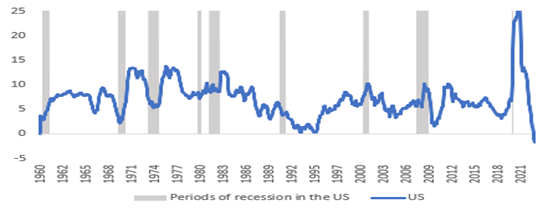
Chart 7: History of US inflation and the recession
 Source: Bloomberg, SBIMF Research
Chart 8: During 1973-75 and 1980, healthy corporate
profits kept the job market data strong
 Source: Bloomberg, SBIMF Research
Table 1: 1973 and 1980 saw jobs growth even into recession
 Source: Bloomberg, SBIMF Research; NB: t refers to the
month of recession onset
Source: Bloomberg, SBIMF Research; NB: t refers to the
month of recession onset
Genuine inflation is nothing more than excessive money
creation chasing too few goods.
While there have been notable supply side improvements,
demand side of the economy remains strong supported by
healthy wage growth. Along with that, the impact of
structural factors relating to geopolitical factors and
energy transition costs add considerable uncertainty.
Policy makers expected that 1970s recession would tame in
inflation. But that did not happen as money supply growth
was strong. 1970s had an excessive money supply growth which
has been curtailed this time. Monetary tightening will
eventually drive cyclical disinflation.
Chart 9: Money supply growth were elevated during 1970s
feeding into stagflation
 Source: Bloomberg, SBIMF Research
As monetary policy works with a lag, we could see its effect
in coming months on both growth and inflation. And with
growth likely slowing across much of the world, commodities
will not be the source of inflation they were over 2021 and
2022 (though they may not see a material dip down either).
The cyclical inflation will come down but there are
structural changes in economy. Global trade has slowed post
GFC. Constrained energy supply, falling productivity and
geopolitics seems most credible threat to medium-term
inflation. Consequently, while CPI could fall owing to
significant tightening- we do not know if it could rise
again as the monetary breaks go loose.
US Fed has been single-mindedly focussed on inflation to the
extent of engineering recession but such aggressive hikes
cannot be without no broken bones especially when leverage
is high.
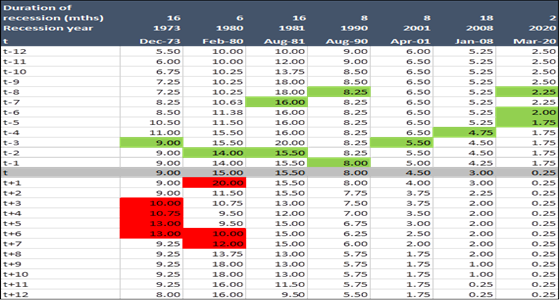
In the past three decades, Federal Reserve that has
typically cut interest rates before the recession has even
begun. However, 1973 and 1980 recession saw rate hikes owing
to higher inflation and strength in job market data. Given
that inflation, corporate profits and job market data rhymes
closer to the decades of 1970s-80s, market has been
consistently trumped in pre-empting rate cuts. US Fed has
hiked rates by 475bps in the current cycle, guides for one
more and then a long pause in 2023.
Table 2: 1973 and 1980 recession saw rate hikes owing to
higher inflation
 Source: Bloomberg, SBIMF Research; NB: t refers to the
month of recession onset
Source: Bloomberg, SBIMF Research; NB: t refers to the
month of recession onset
We are witnessing synchronized and aggressive global
monetary tightening at a time when industrial recession has
already begun. We do not know how severe this recession is
going to be. But the kind of aggression in rate hikes makes
a case for more severe than for being it mild.
Chart 10: Synchronized policy tightening
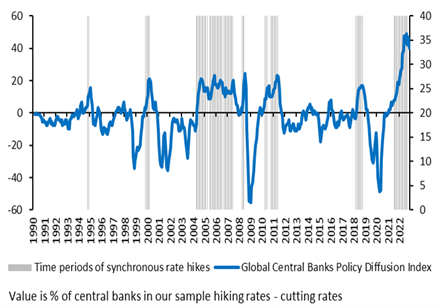
Chart 11: And too high too soon.
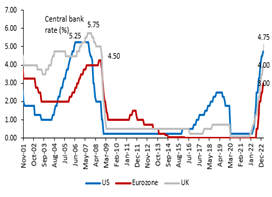 Source: Bloomberg, SBIMF Research; NB: Global Central Bank
policy diffusion index is based on sample of 30 countries
Source: Bloomberg, SBIMF Research; NB: Global Central Bank
policy diffusion index is based on sample of 30 countries
Leverage if the biggest problem today. The aggressive rate
hikes of 1980s to single-mindedly tame down inflation was
also made possible due to contained leverage in the system.
US had successively managed to bring down its post war debt
(from 95% of GDP in 1947 to 35% of GDP in 1980). Well,
things are quite different today.
Government debt to GDP stands at 110%. Even as the real
economy impact may be delayed, recent events in the US and
European banking space confirmed, in case there was ever any
doubt, that the fastest and most aggressive tightening cycle
in four decades is having an impact. The entire last decade
was built on era of low inflation, near zero rates and
large-scale asset purchases. Today, financial institutions
have found themselves inadequately hedged against interest
rate risks. Further bouts of turmoil cannot be ruled out.
US Fed today: Damned if you do, Damned if you don’t.
Banking sector concerns led markets to price an abrupt end
to the hiking cycle and a substantial probability of policy
rate cuts. Well, that did not happen. Fed Funds rate was
hiked by another 25bps in Mar’23 meeting and the dot plot
remained unchanged implying one more hike and then a long
pause in 2023
But market wants cuts- fast and deep. Inflation and
employment backdrop is too strong for the US Fed to go all
out in the support of financial stability. Either of the two
thing has to happen for market expectations to materialize.
If the earning recession that we spoke of commence and US
start losing jobs or inflation solves for itself in next
couple of months- that would help the Fed to lend an extra
support on financial stability. Or another possible outcome
is that more of Silicon Valley types issue spring up,
leading Fed to prioritize financial stability over
inflation.
To certain extent, the current banking sector episode in the
US will translate into tighter regulations and profitability
compression for banks, implying tighter credit conditions.
In a fractional reserve banking system, this is the
transmission mechanism slowing growth. But that aside, this
financial turmoil will make it difficult for the Fed to
fight inflation as hard as they desired. And that in turn
means that market volatility will continue as investors keep
betting on assets that have higher beta to dovish tilt and
assets that do not.
How does US equity market behave during their recessions?
Both aggressive tightening thus far and concerns on
financial stability implies slower growth going ahead and
then key is to figure out how does market behave (we study
equity and fixed income here) during growth corrections.
We studied past recession in the US and figured out that
equity market starts to correct prior to recession onset but
bottoms out even as we are into the recession- with few
exceptions. One such exception is the equity market bull run
of 1980s. During 1980s, we had three episodes of recession
within a decade. There were small market corrections- but
not meaningful given the extent of rally we saw during that
period. One plausible reason could be massive decline in Fed
Funds rate during the decade which could have led to equity
valuation re-rating. Fed Funds rate fell from 20% to settle
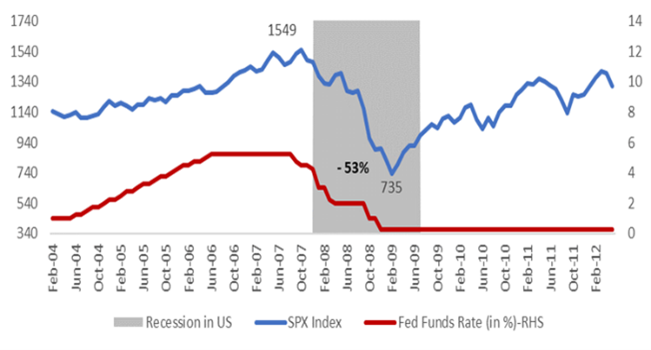
at 5% by 1990s. On the other hand, during 1973, 2001 and
2008 recession, S&P fell by ~50%. On other occasions, there
has been ~20% corrections (1981, 1990 and 2020 recession).
Currently, S&P has fallen 17% from its peak.
Thus, if history is any guide, there are more pains left and
perhaps equity market should bottom out by end 2023.
Chart 12: 1973 Recession- market corrects 46%
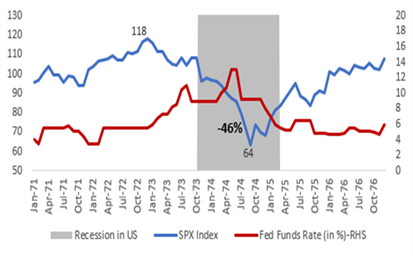
Chart 13: 1980, 1981 and 1990 Recession
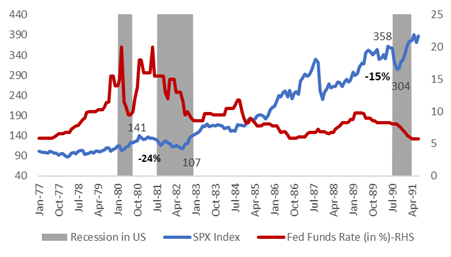
Chart 14: 2001 recession
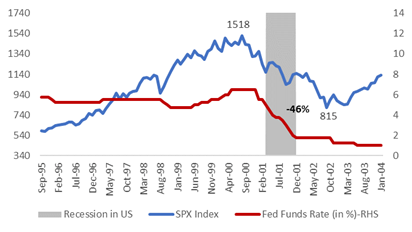
Chart 15: 2008 Recession
 Source: Bloomberg, SBIMF Research
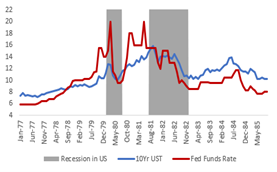
When does Duration start to perform?
If one were to look at last two decades, the answer is very
simple. Duration starts to perform at mature stage of rate
hiking cycle. However, the high inflationary periods of
1970-80s were very different. 10-year UST rose into 1973 and
1980 recession. That could perhaps be explained by high
inflation leading market to doubt the longevity of rate
cuts.
Chart 16: 2001 Recession and 10Yr UST
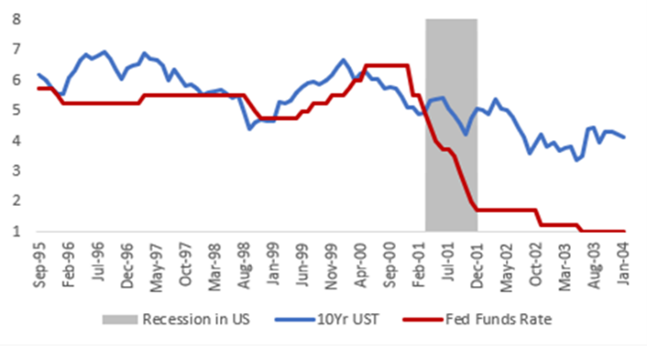
Chart 17: 2008 Recession and 10Yr UST
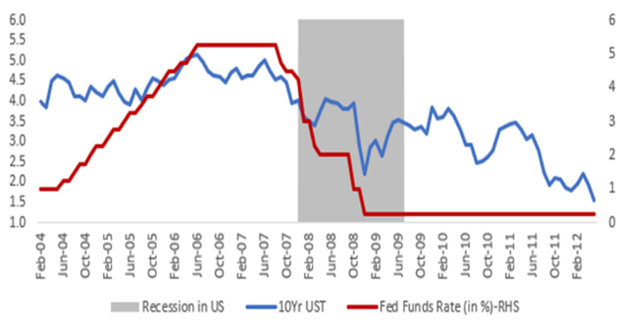
Chart 18: 1973 recession and 10Yr UST
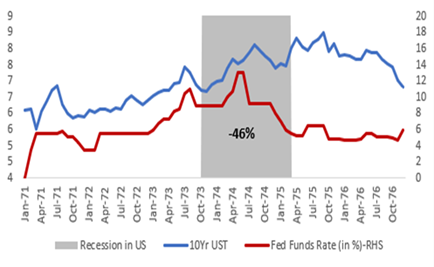
Chart 19: 1980s recession and 10Yr UST
 Source: Bloomberg, SBIMF Research
On top of that, another angle is the financial stability
concerns. 2008 GFC crisis was followed by sharp rate cuts.
But in 1980s financial stability concerns had interrupted
the hiking cycles but did not end them.
Mapping this history in the current context, sharp monetary
tightening in last one year should drive cyclical
disinflation- though one could argue that 2% inflation
target may still be far-fetched. On top of that, the issues
of financial stability could provide a breather to rate
hikes. But like we said, we do not know as yet whether
market today is mimicking the past three decades a long
period rally in fixed income assets or 1970-mid 80s where
the rally is short-lived and frequently punctuated with
reversal in rate cycles.
2022 was one of the worst years for combined returns of
stocks and bonds market in the US. In 2023, equity market
prospects is still grim unless we see a significant dovish
tilt by the US Fed and greater clarity on depth and
breadth of recession. Outlook for duration assets is
improving at the margin. That said, longevity of duration
rally can be challenged unless inflation is brought under
complete control.
This presentation is for information purposes only and is
not an offer to sell or a solicitation to buy any mutual
fund units/securities. The views expressed herein are based
on the basis of internal data, publicly available
information & other sources believed to be reliable. Any
calculations made are approximations meant as guidelines
only, which need to be confirmed before relying on them.
These views alone are not sufficient and should not be used
for the development or implementation of an investment
strategy. It should not be construed as investment advice to
any party. All opinions and estimates included here
constitute our view as of this date and are subject to
change without notice. Neither SBI Funds Management Limited,
SBI Mutual Fund nor any person connected with it, accepts
any liability arising from the use of this information. The
recipient of this material should rely on their
investigations and take their own professional advice.







)
d7a82bd424794b57a015914cd7b8baab)
)
)