Change is constant: Disentangling Big Style Shifts
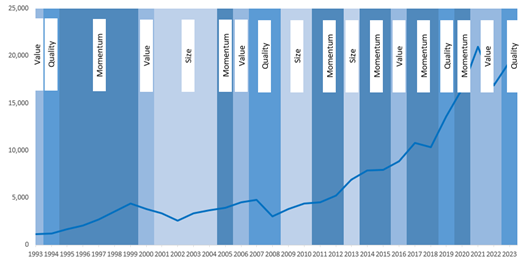
Chart 1 depicts the performance of MSCI USA Index (total
returns, USD) since 1993 till date and we can observe that
valuation, quality, momentum and size have outperformed at
different points in time. MSCI does not consider growth as a
separate factor as it is complementary to the value factor.
MSCI provides an easy and accessible range of well
documented regional factor-based indices dating back to at
least 2002 and is widely used by global investors and ETF
providers.
As observed globally, value as a factor, which dominated the
early decade of the century (with size), made a comeback in
2021-2022, after a decade of dominance of momentum and
growth1. By definition, quality is a defensive factor which
explains why it outperformed during the GFC.
More importantly, factor rotation has increased over the
last decade compared to the end of the 1900s.
Chart 1: Best Performing Factor and the MSCI USA Index
 Sources: Factset, MSCI
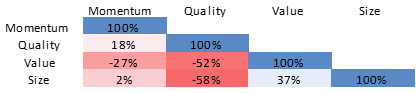
Table 1: Correlation between MSCI US Style Factors
(1993-2023)
There is no unanimity around growth factors. Some simply
considers the factor as an anti-Value factor.
It is interesting, that momentum is hardly correlated to
quality, value and size. One explanation can be that
momentum is simply the consequence of the autocorrelation of
factor returns due to the investor sentiment driven by fear
and greed creating systematic trends over time. If momentum
is simply be an aggregation of autocorrelations of other
factors, it should not be considered as a separate factor.
Not all academics agree but momentum is widely considered as
a factor, especially since the academic works of Jegadeesh
and Titman (1993) and Cahart (1997) were published.
Reassuringly, value and quality factors are anticorrelated.
This is by definition. Quality mimicking portfolios are made
of companies with a strong balance sheet and are profitable.
While value mimicking portfolios are generally composed of
out of flavour or fundamentally distressed stocks.
Similarly, quality and size are anticorrelated. By size, we
mean mid and small cap stocks. One reason can rely on the
fact that mid and small cap companies are generally less
established and less profitable than quality stocks.
It is important to understand the correlation and covariance
between factors because it explains how factors
concomitantly perform and is also a starting point for the
creation of a multi-factor model with uncorrelated
sub-factors.
Identifying market regimes and understanding equity factor
performances provide opportunities to time the market and
equity factors. Lots of academic research has been written
on the topic with varying conclusions. That’s for another
day.
Factor Investing and Factor Regimes in India
Back home in India, different market regimes have been
favourable for specific styles to outperform. Indian
markets, in the past, have witnessed periods of a particular
style standing out in performance. For our analysis, we have
considered the Nifty 50 as a proxy for Indian markets. Also,
we define growth style with both past earnings parameters &
earnings revision which could be different from academic
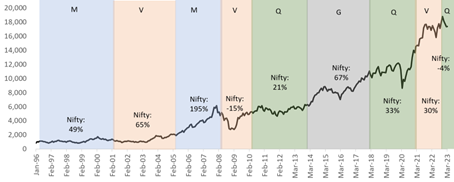
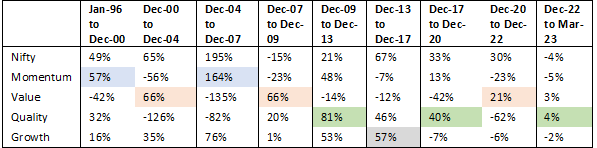
research & others such as MSCI. In chart 2, we looked at
Nifty 50 returns across a span of 27 years & the best
performing style in different periods. Duration of these
style regimes have varied with multi-year style periods like
the outperformance of quality from 2009 to 2013. There have
also been shorter style cycles like value performance
between 2007 to 2009. We, also, notice that when momentum or
growth are the top performing style, market return is higher
compared to when quality outperforms.
There are periods of time where factors in India and the
world work alongside and some periods where it is specific
to the market.
Chart 2: Style Performance across Different Regimes
 Source: SBI MF Research, Factset M= Momentum, V= Value, Q=
Quality, G= Growth; Returns are long-short returns i.e.,
average of top 2 quintile minus the bottom 2 quintiles.
Quintiles refers to dividing the data set into 5 equal
groups i.e., each being 20% of the data set. The top
quintile is the top 20% of the data set.
Source: SBI MF Research, Factset M= Momentum, V= Value, Q=
Quality, G= Growth; Returns are long-short returns i.e.,
average of top 2 quintile minus the bottom 2 quintiles.
Quintiles refers to dividing the data set into 5 equal
groups i.e., each being 20% of the data set. The top
quintile is the top 20% of the data set.
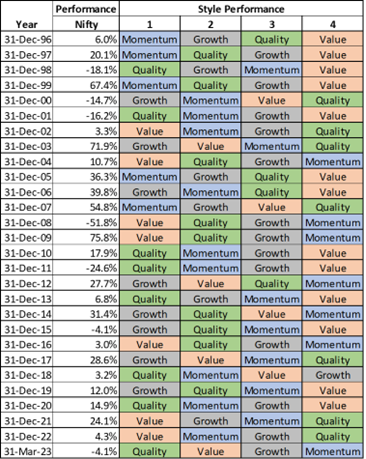
If we look at calendar year performance of different styles
(table 2), quality & growth are the most frequent top
performing styles; however, they outperform during different
market regimes. Growth outperformed when markets gave an
average return of 24%. Quality, however, is the
top-performing style when markets are down with an average
return of -2.5%. Expectedly, quality outperforms when
markets are down.
Table 2: Calendar Year Style Performance
 Source: SBI MF Research, Factset Returns are long-short
returns i.e., average of top 2 quintile minus the bottom 2
quintiles. Quintiles refers to dividing the data set into
5 equal groups i.e., each being 20% of the data set. The
top quintile is the top 20% of the data set.
Source: SBI MF Research, Factset Returns are long-short
returns i.e., average of top 2 quintile minus the bottom 2
quintiles. Quintiles refers to dividing the data set into
5 equal groups i.e., each being 20% of the data set. The
top quintile is the top 20% of the data set.
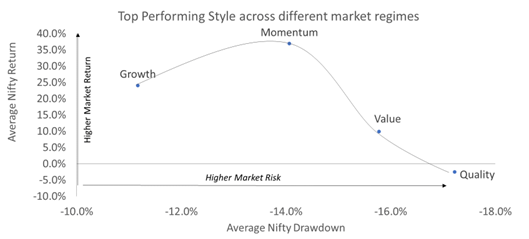
This brings us to the question on whether certain styles
perform in specific market regimes. An insight into style
characteristics helps us to tilt a portfolio based on our
market expectations. In chart 3, we have plotted the average
market return & drawdown when a certain style is the top
performing style in that calendar year. When momentum &
growth are the top-performing styles, average market returns
are higher & drawdown is lower. Value outperforms when
market returns are lower while remaining positive. However,
when value is the top performer, markets have a higher
drawdown. Predictably, quality is the top performing style
when the market average return is negative with the highest
drawdown.
Chart 3: Style Characteristics
 Source: SBI MF Research, Factset
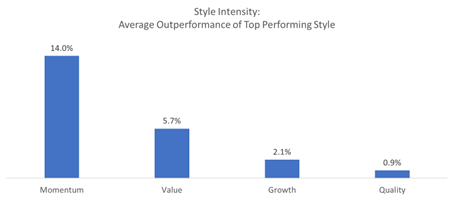
The quantum of outperformance across various styles will
also vary. In chart 4, we measure the style intensity i.e.,
the quantum of outperformance over the market in a year when
that style is the best-performing. Assuming an average
market return in a calendar year is 15%, whenever momentum
is the best performing style, it has the largest
outperformance. On the flipside, in a year when quality tops
the style charts, it has only a marginal outperformance over
markets.
Chart 4: Style Intensity
 Source: SBI MF Research, Factset Returns are long-short
returns i.e., average of top 2 quintile minus the bottom 2
quintiles. Quintiles refers to dividing the data set into
5 equal groups i.e., each being 20% of the data set. The
top quintile is the top 20% of the data set.
Source: SBI MF Research, Factset Returns are long-short
returns i.e., average of top 2 quintile minus the bottom 2
quintiles. Quintiles refers to dividing the data set into
5 equal groups i.e., each being 20% of the data set. The
top quintile is the top 20% of the data set.
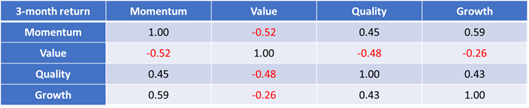
Understanding the correlation of styles helps us to improve
diversification in our portfolios while controlling risk. In
table 3, we look at the 3-month return correlation of
styles. We can see in the table below that value has the
largest negative correlation with momentum & quality. This
suggests that value, typically, will move in an opposite
direction compared to momentum & quality.
Table 3: Style Correlation
 Source: SBI MF Research, Factset Returns are long-short
returns i.e., average of top 2 quintile minus the bottom 2
quintiles. Quintiles refers to dividing the data set into
5 equal groups i.e., each being 20% of the data set. The
top quintile is the top 20% of the data set.
Source: SBI MF Research, Factset Returns are long-short
returns i.e., average of top 2 quintile minus the bottom 2
quintiles. Quintiles refers to dividing the data set into
5 equal groups i.e., each being 20% of the data set. The
top quintile is the top 20% of the data set.
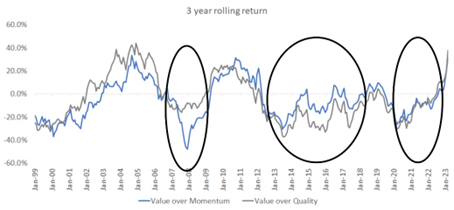
In chart 5, we compare the 3-year active return of value
over momentum & quality. Periods when the active return is
below 0% are cycles when momentum & quality have
outperformed as styles over value.
Chart 5: 3-year rolling-returns
 Source: SBI MF Research, Factset Returns are long-short
returns i.e., average of top 2 quintile minus the bottom 2
quintiles. Quintiles refers to dividing the data set into
5 equal groups i.e., each being 20% of the data set. The
top quintile is the top 20% of the dataset.
Source: SBI MF Research, Factset Returns are long-short
returns i.e., average of top 2 quintile minus the bottom 2
quintiles. Quintiles refers to dividing the data set into
5 equal groups i.e., each being 20% of the data set. The
top quintile is the top 20% of the dataset.
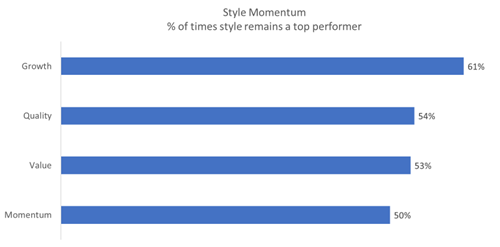
Just like stocks have momentum, styles have the tendency to
persist, in the near term, with their recent performance.
Here, in chart 6, we look at whether a style which is a top
performing style in the previous 2 months retains its
performance in the next month. Growth, as a style, appears
to have the strongest persistence in momentum followed
closely by quality & value.
Chart 6: Style Momentum
 Source: SBI MF Research, Factset Returns are long-short
returns i.e., average of top 2 quintile minus the bottom 2
quintiles.6 month return has been considered for the above
calculation. Quintiles refers to dividing the data set
into 5 equal groups i.e., each being 20% of the data set.
The top quintile is the top 20% of the data set.
Source: SBI MF Research, Factset Returns are long-short
returns i.e., average of top 2 quintile minus the bottom 2
quintiles.6 month return has been considered for the above
calculation. Quintiles refers to dividing the data set
into 5 equal groups i.e., each being 20% of the data set.
The top quintile is the top 20% of the data set.
Another interesting question could be whether style
performance in US markets are lead indicators for style
performance in Indian markets. While the correlation
coefficient doesn’t seem to be significantly high, 3-month
quality performance in the US has a negative correlation
with forward 6-month India momentum & growth style returns.
Table 4: Correlation with US Style Factors
 Source: SBI MF Research, Factset Returns are long-short
returns i.e., average of top 2 quintile minus the bottom 2
quintiles. Quintiles refers to dividing the data set into
5 equal groups i.e., each being 20% of the data set. The
top quintile is the top 20% of the data set.
Source: SBI MF Research, Factset Returns are long-short
returns i.e., average of top 2 quintile minus the bottom 2
quintiles. Quintiles refers to dividing the data set into
5 equal groups i.e., each being 20% of the data set. The
top quintile is the top 20% of the data set.
Appendix:
Momentum: In the momentum factor, stocks are ranked based on
their near to medium term performance. Stocks that have
performed in the near term are ranked higher than laggards.
We look at parameters such as 6- & 12-month price
performance, 1 month price reversion, nearness to 52-week
high, etc.
Value: In the value factor, stocks are ranked based on
various valuation ratios; inexpensive stocks relative to
their fundamentals are ranked higher. In the Value factor,
we look at parameters such as price to earnings, price to
book value, enterprise value to sales, dividend yield etc.
Quality: In the quality factor, stocks are ranked based on
various earnings & balance sheet parameters such that high
quality stocks with stable earnings & robust business models
are ranked higher. This is a defensive factor; we look at
parameters such as return on equity, leverage, earnings risk
etc.
Growth: In the growth factor, stocks are ranked based on
various historical earnings, expected earnings & consensus
ratings such that high growth stocks with higher
expectations are ranked higher. In the growth factor, we
look at parameters such as trailing earnings growth,
consensus earnings revision, consensus earnings upgrades to
downgrades, etc.
This presentation is for information purposes only and is
not an offer to sell or a solicitation to buy any mutual
fund units/securities. The views expressed herein are based
on the basis of internal data, publicly available
information & other sources believed to be reliable. Any
calculations made are approximations meant as guidelines
only, which need to be confirmed before relying on them.
These views alone are not sufficient and should not be used
for the development or implementation of an investment
strategy. It should not be construed as investment advice to
any party. All opinions and estimates included here
constitute our view as of this date and are subject to
change without notice. Neither SBI Funds Management Limited,
SBI Mutual Fund nor any person connected with it, accepts
any liability arising from the use of this information. The
recipient of this material should rely on their
investigations and take their own professional advice.








)
)